Research Areas
My research interests are Information Visualization, Visual Analytics, Human-computer Interaction and Explainable Artificial Intelligence. My major research goal is to develop cutting-edge information visualization techniques and human-AI collaborative visual analytics systems for big data exploration in critical applications:
- Information Visualization: AI for VIS: AI-powered data visualization and graph visualization;
- Visual Analytics for critical applications: Quantum Computing, FinTech, online learning, video-driven presentation training, Social Media and Explainable AI.
Information Visualization
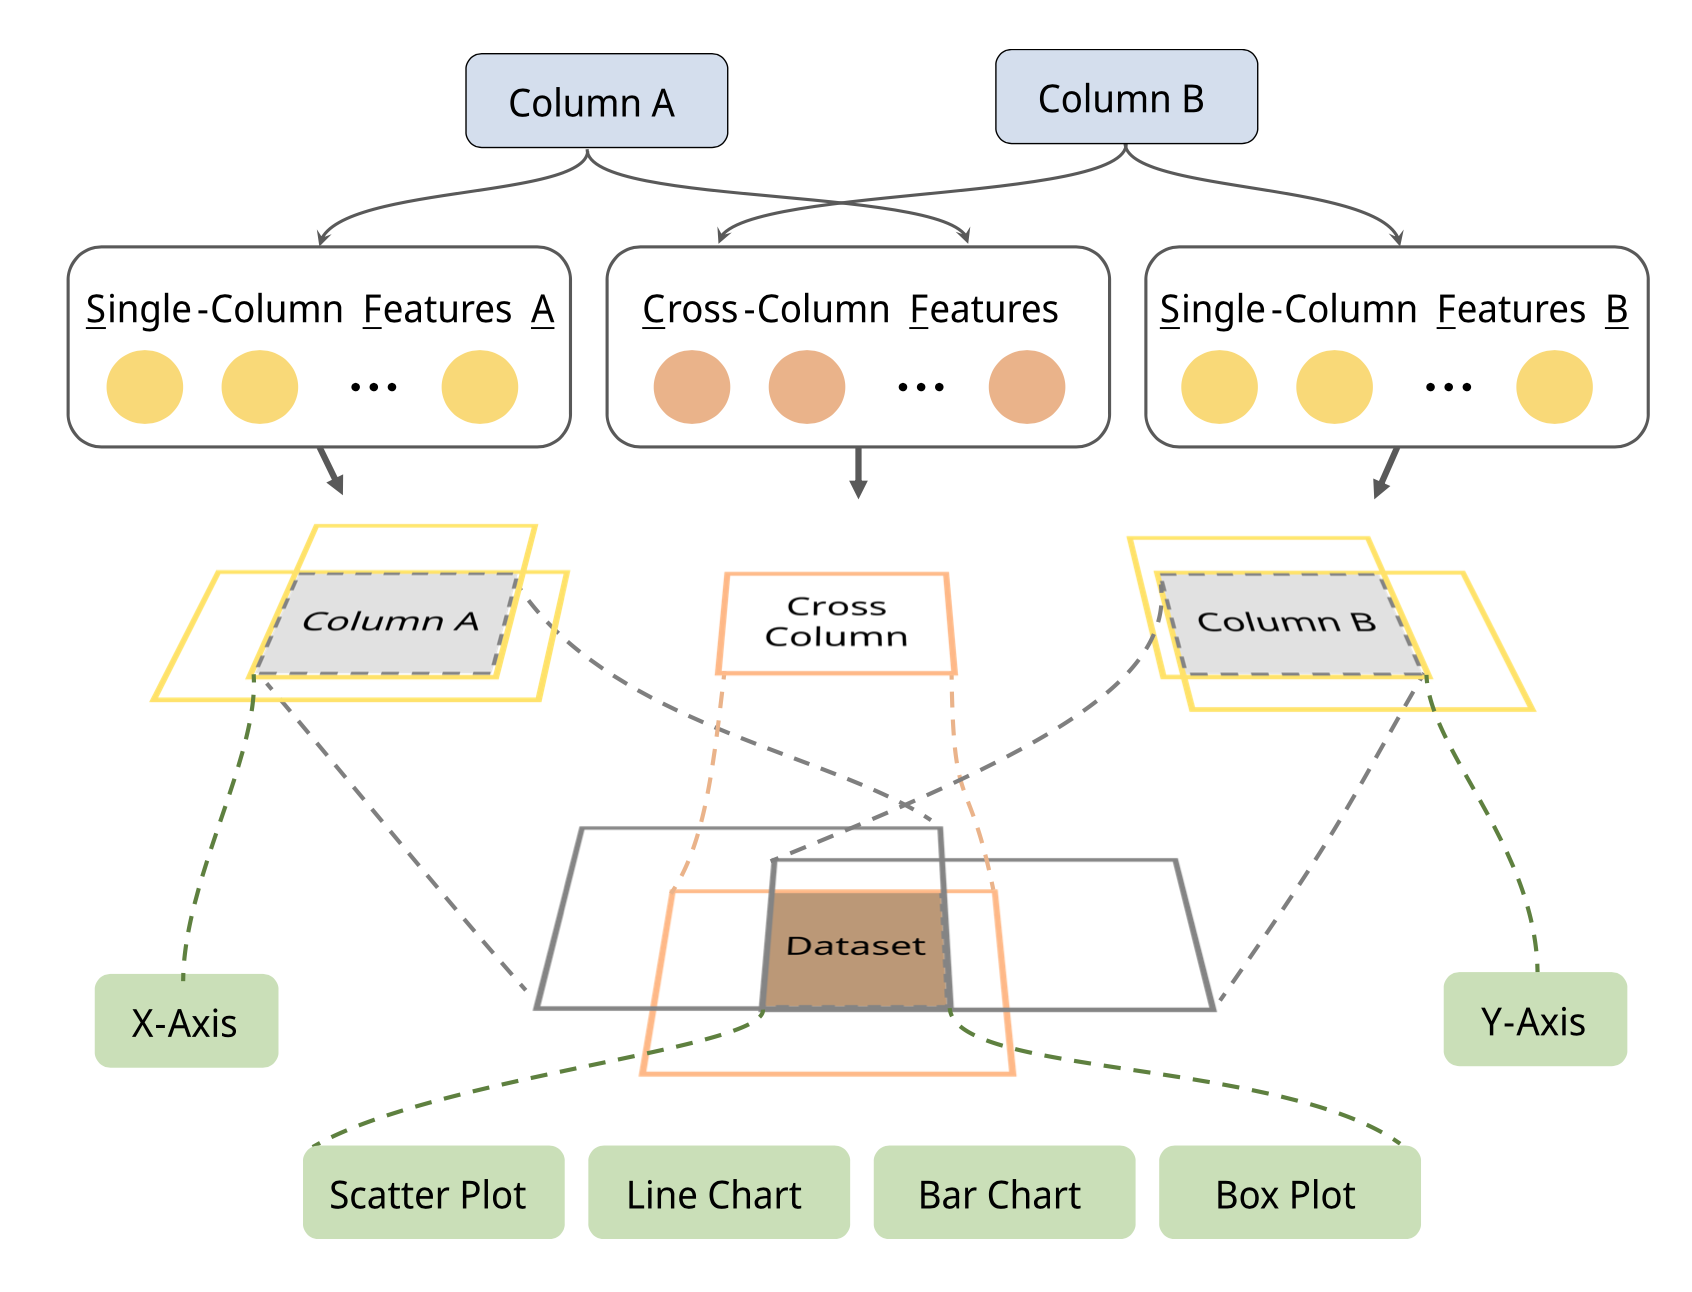
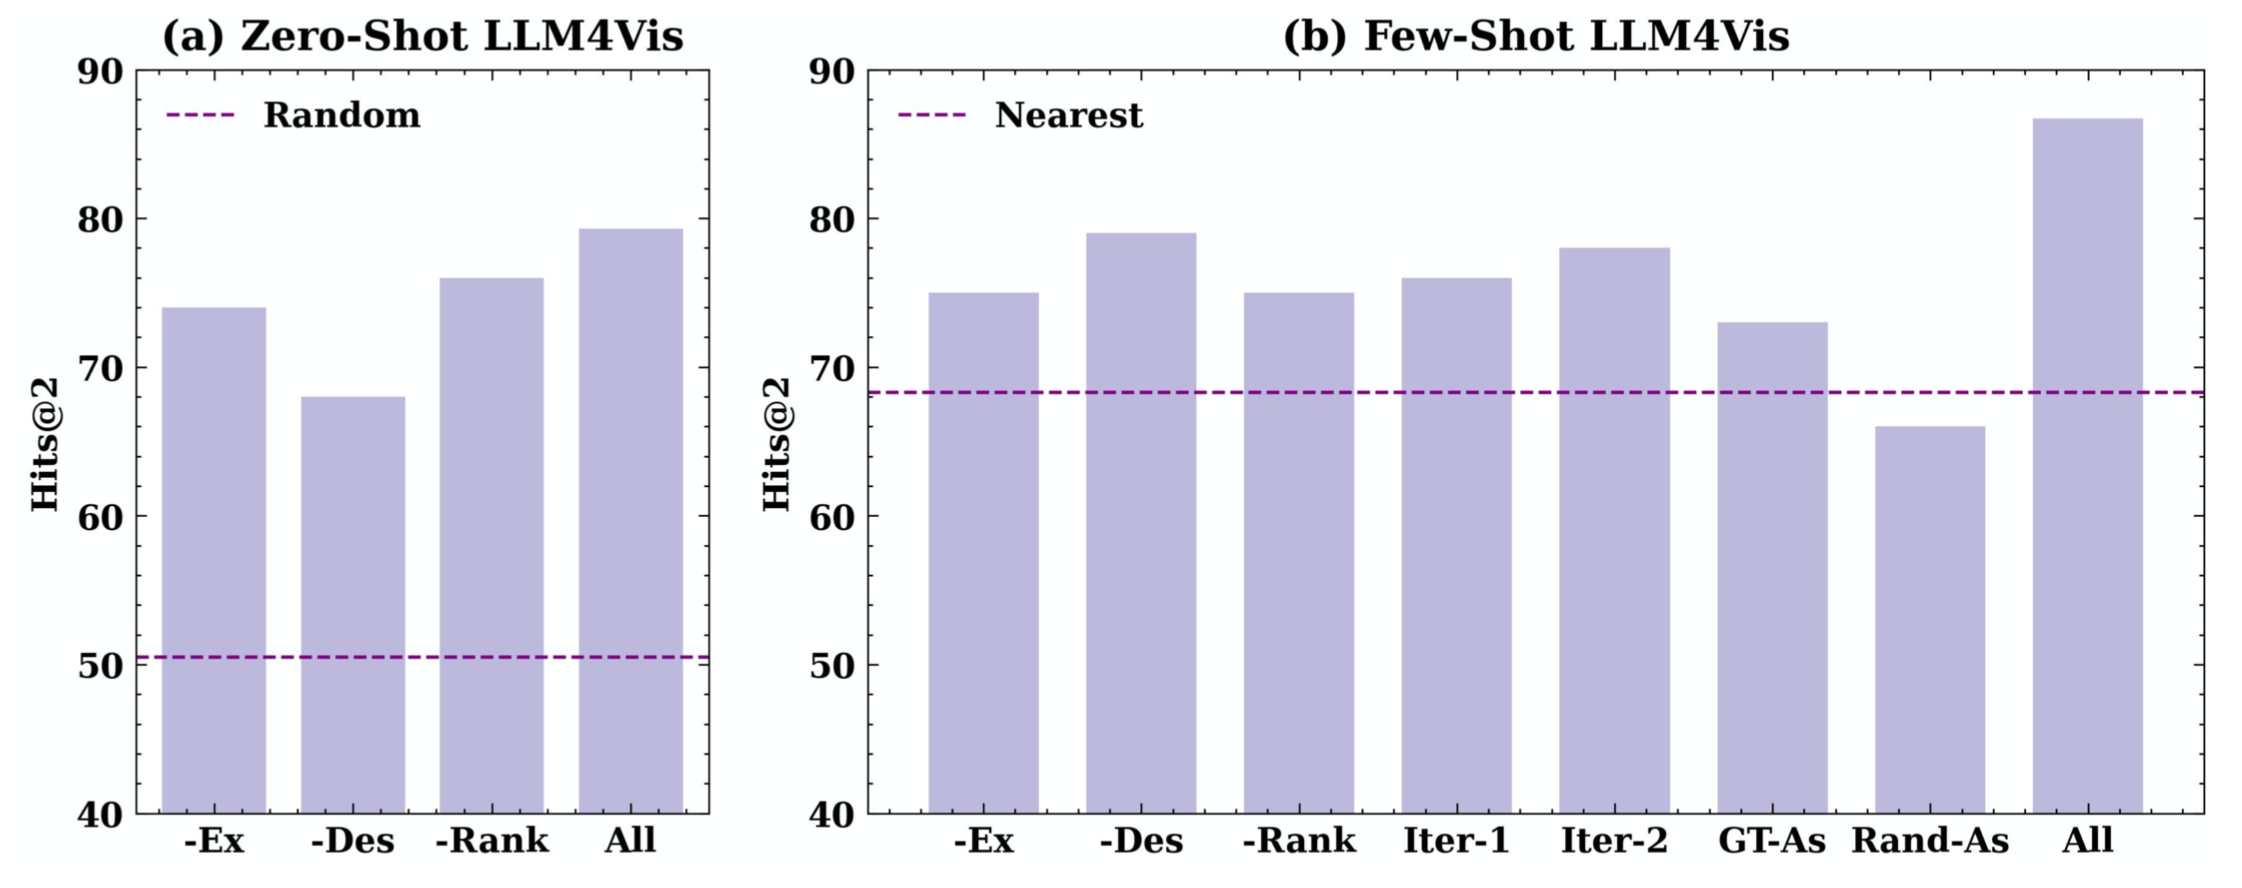
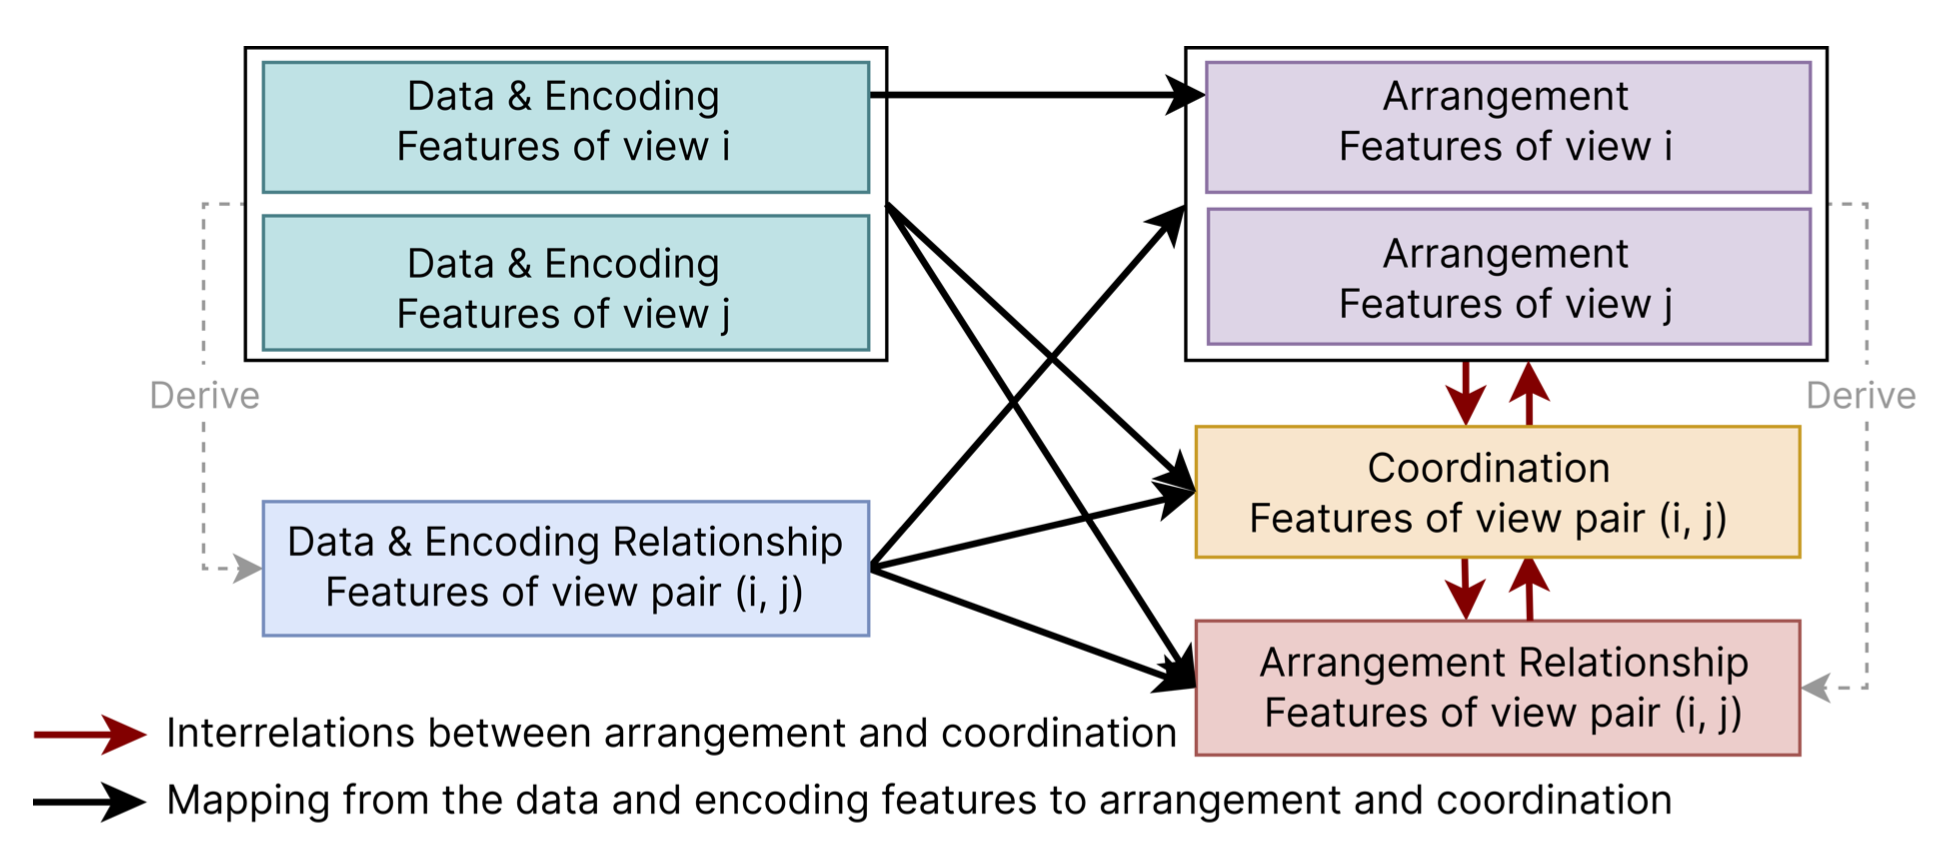
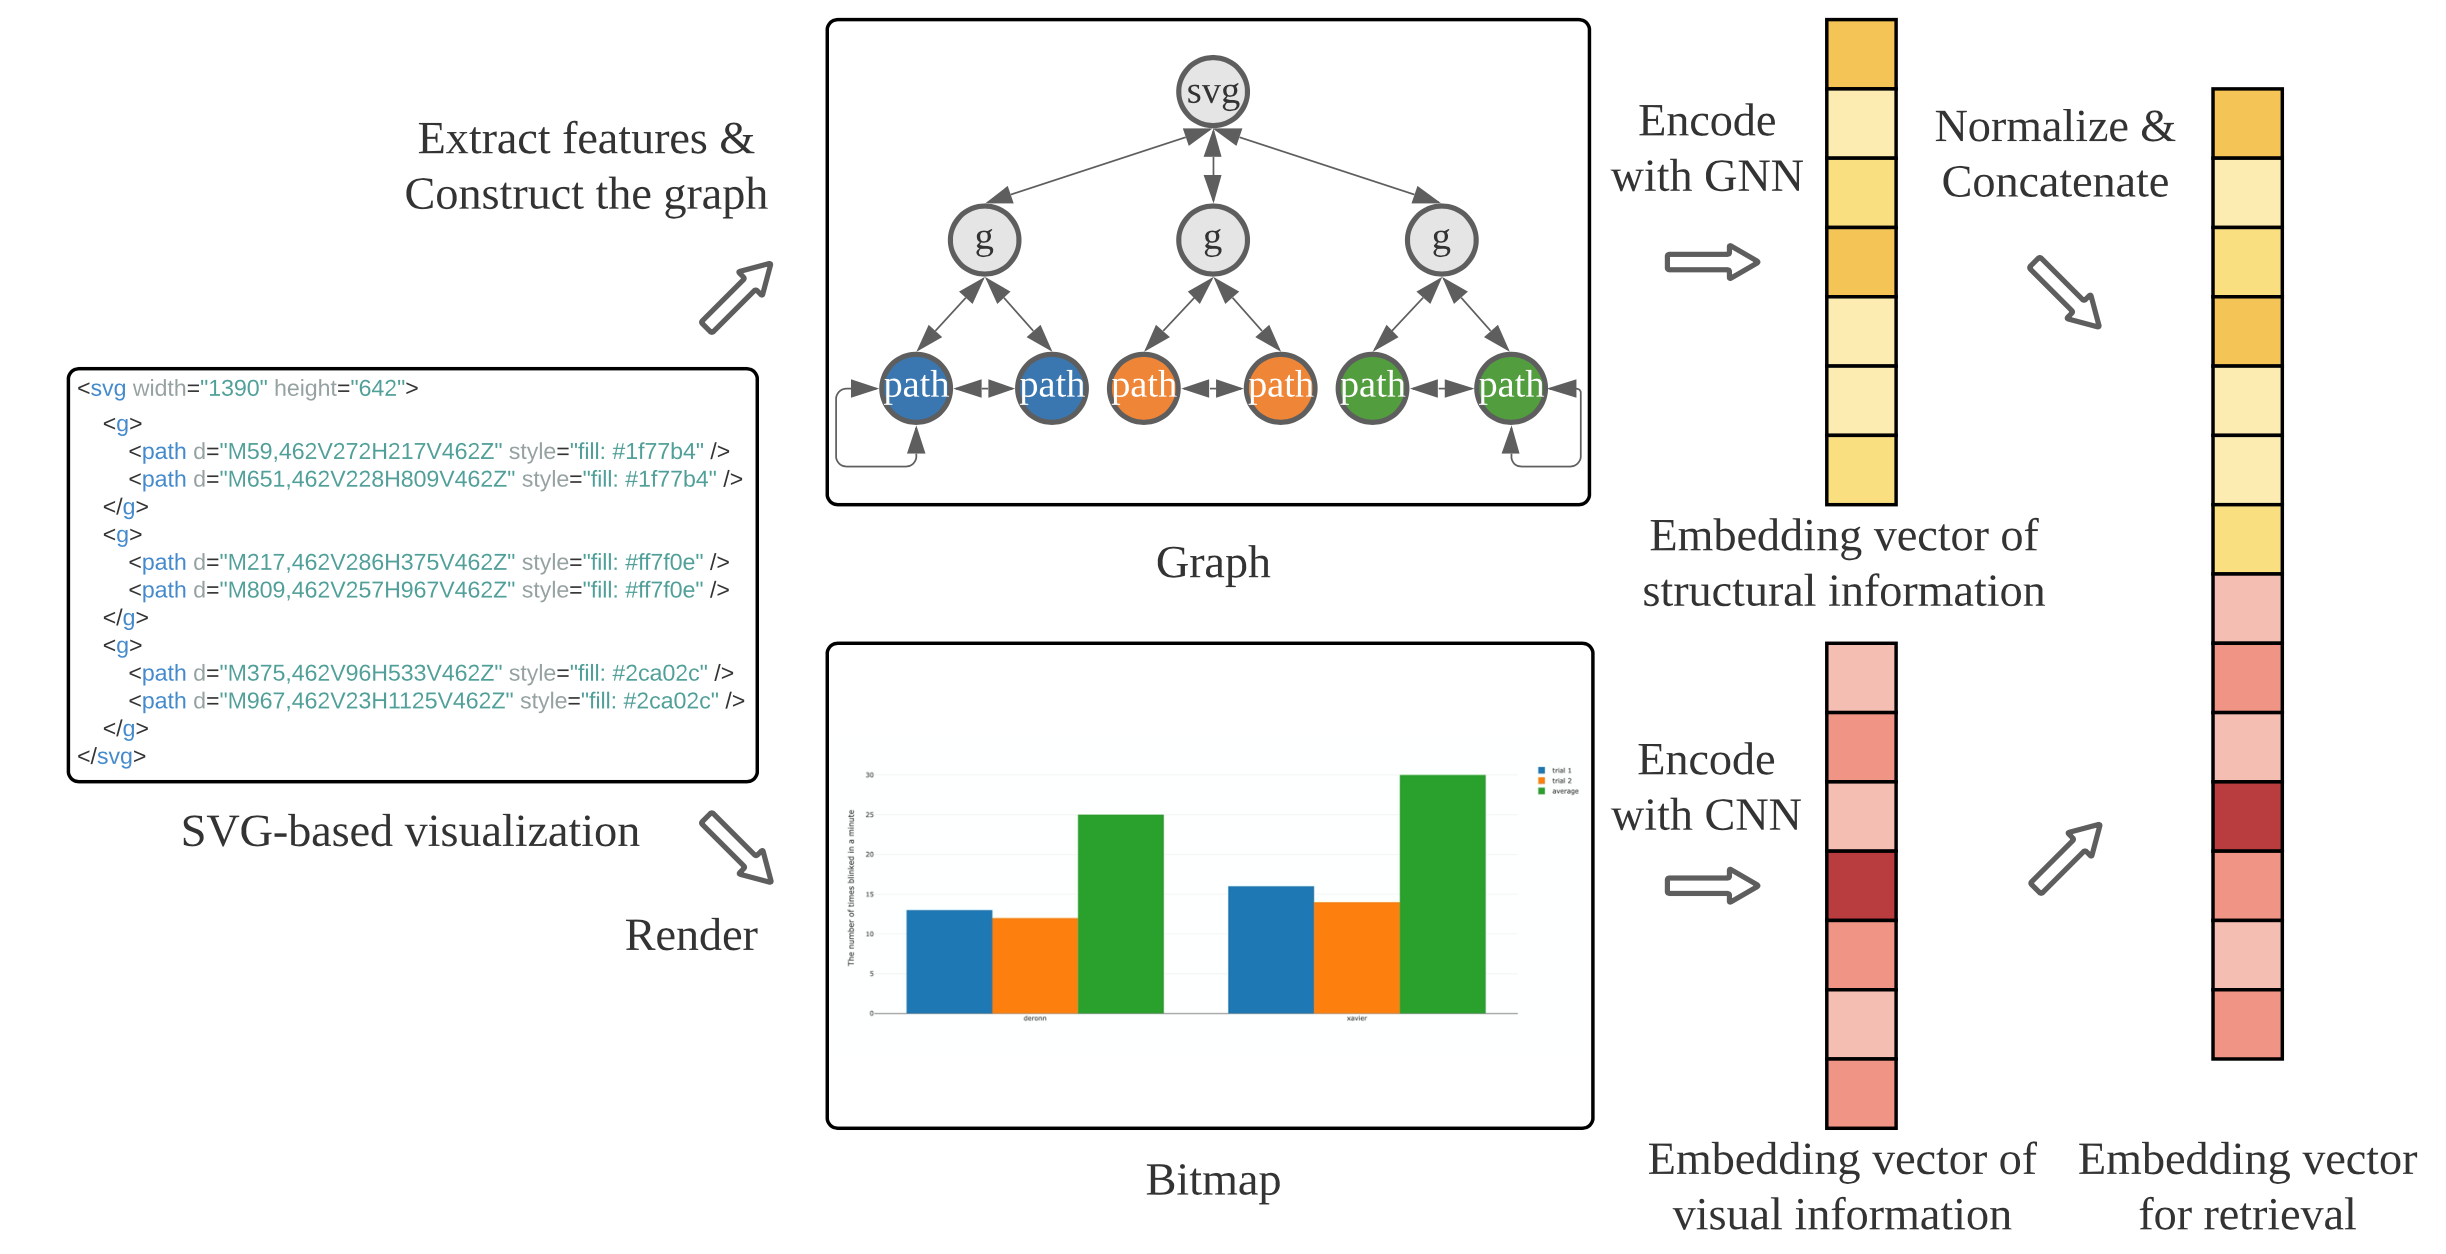
AI for VIS: AI-powered Data Visualization
Data visualization maps original data to a visual representation and can effectively deliver messages in an engaging and memorable manner. Thus, data visualization has gained tremendous popularity in many application areas, such as business, finance, social media and healthcare. However, it is non-trivial to create expressive data visualizations to effectively deliver insights, especially for non-expert users, as it often requires expert knowledge to design and generate appropriate data visualizations. We have done a set of preliminary studies on developing machine learning techniques to ease the data visualization designs and make data visualization more accessible to general users, including automated graph drawing and evaluation (as mentioned above), and infographics generation.


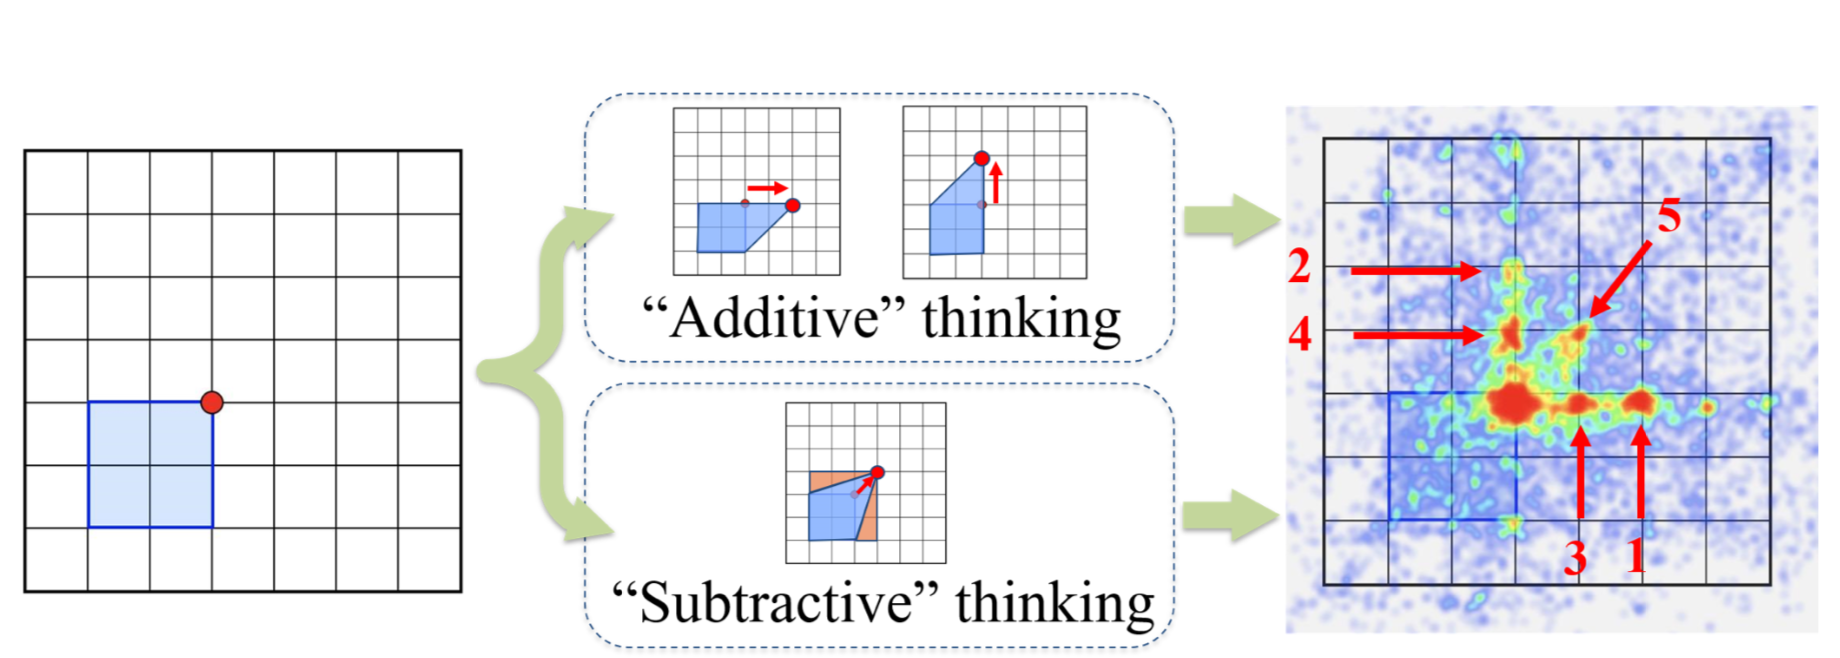
Graph Visualization
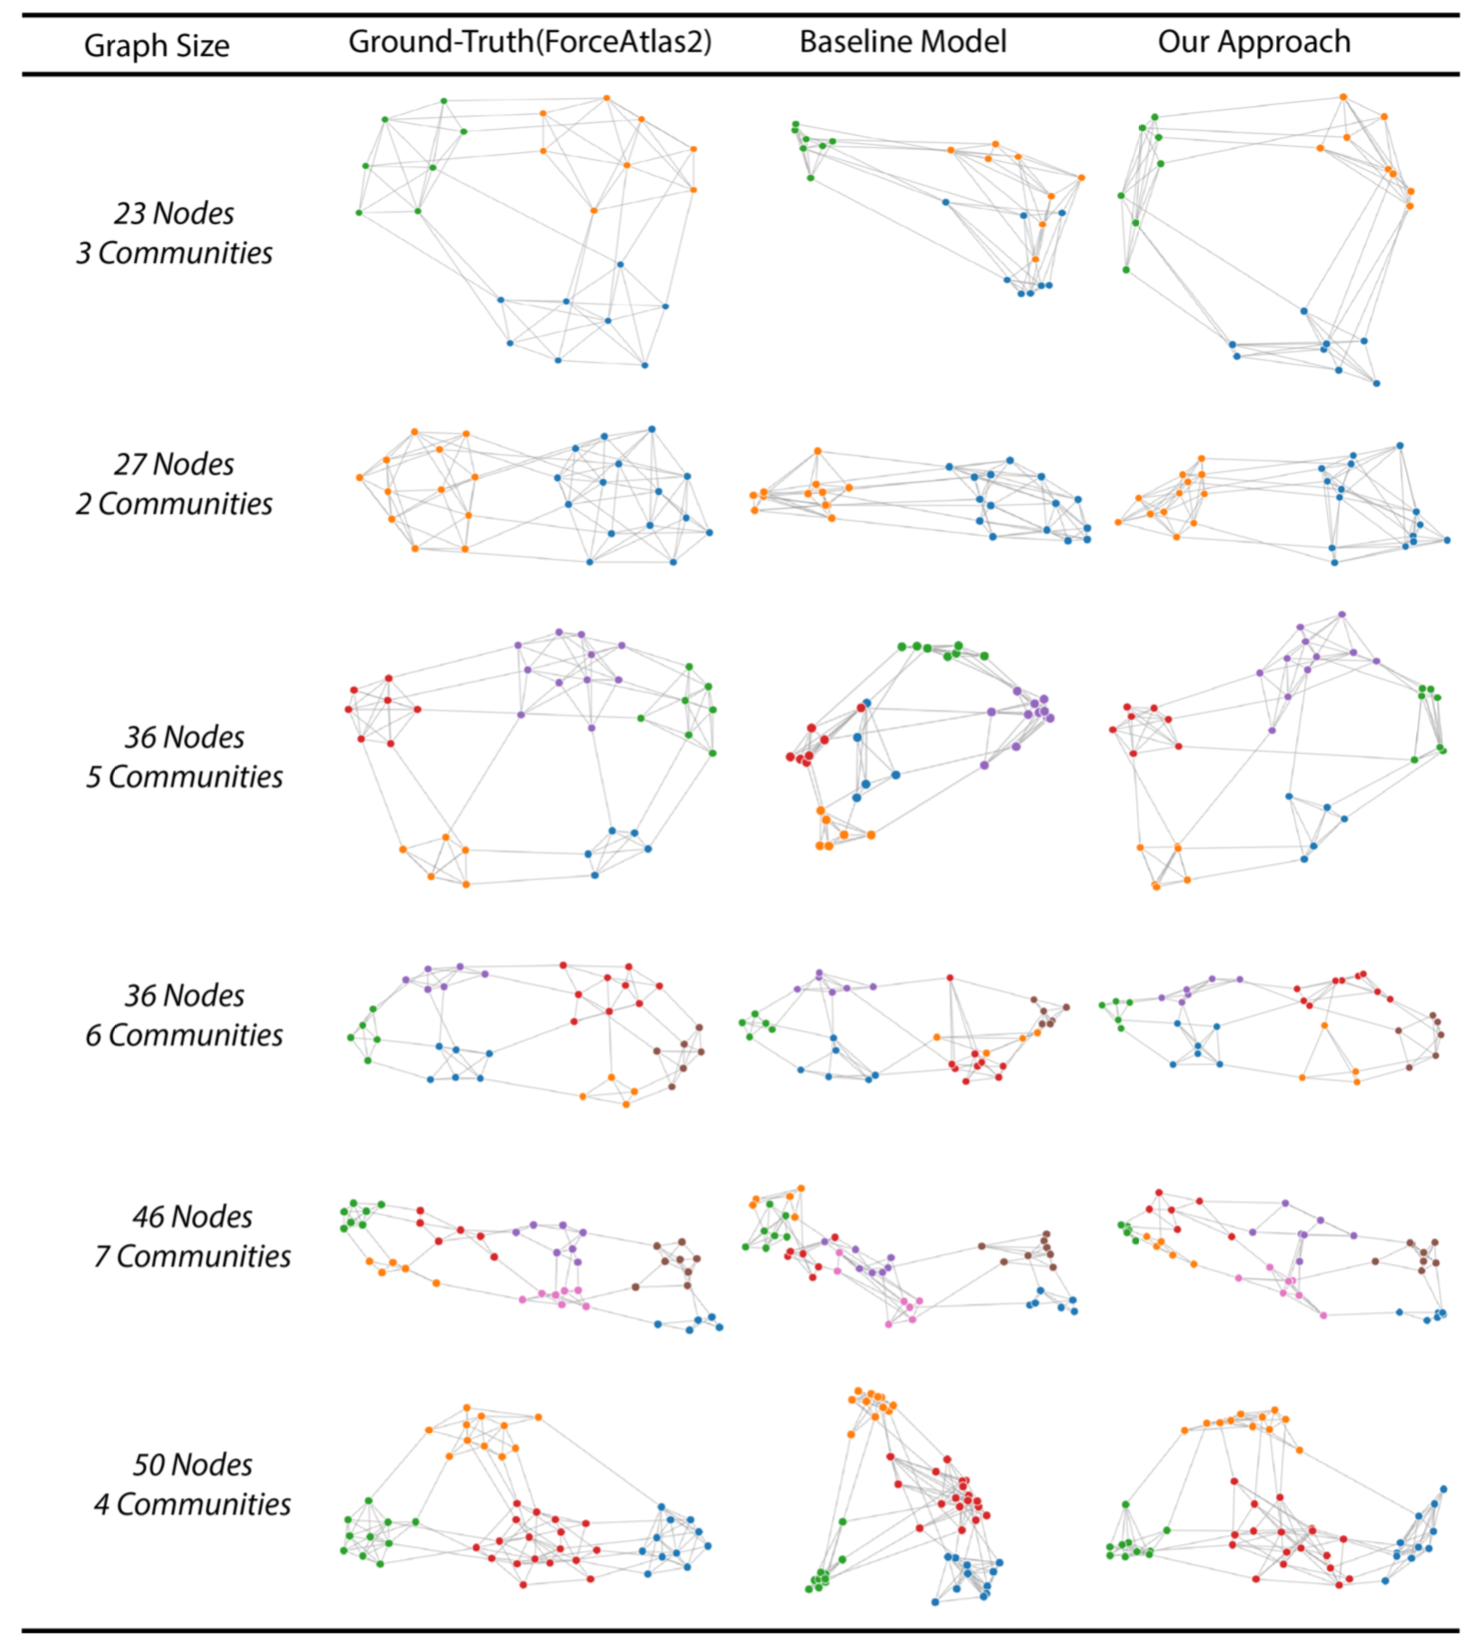
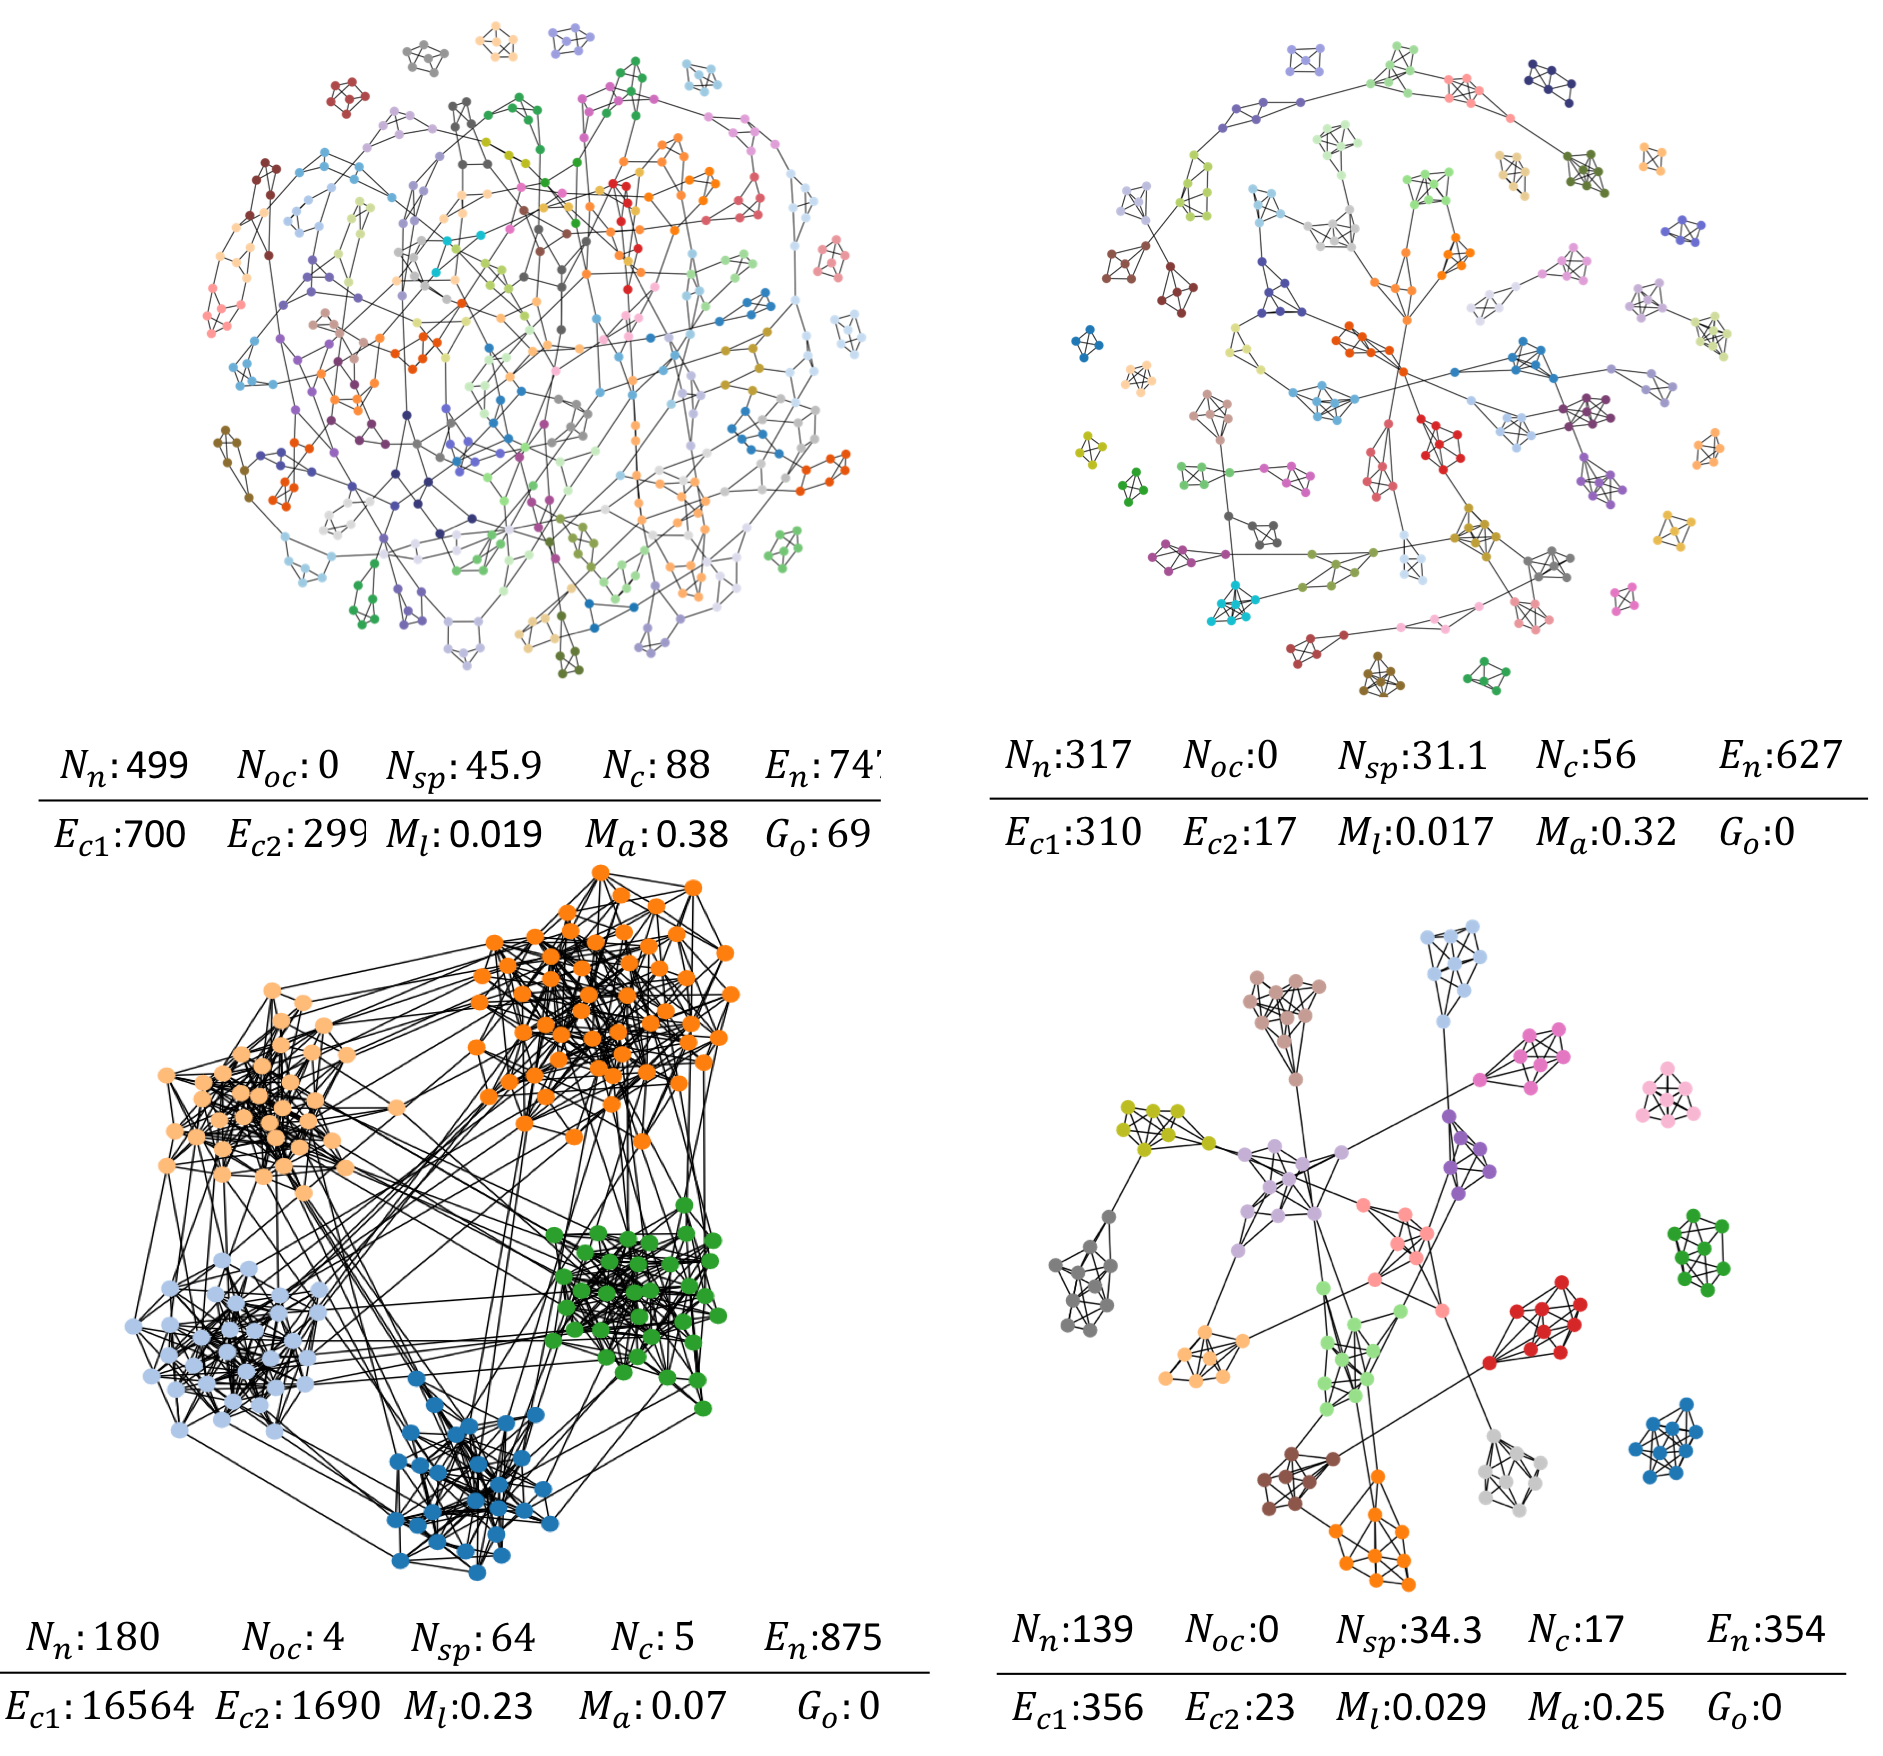
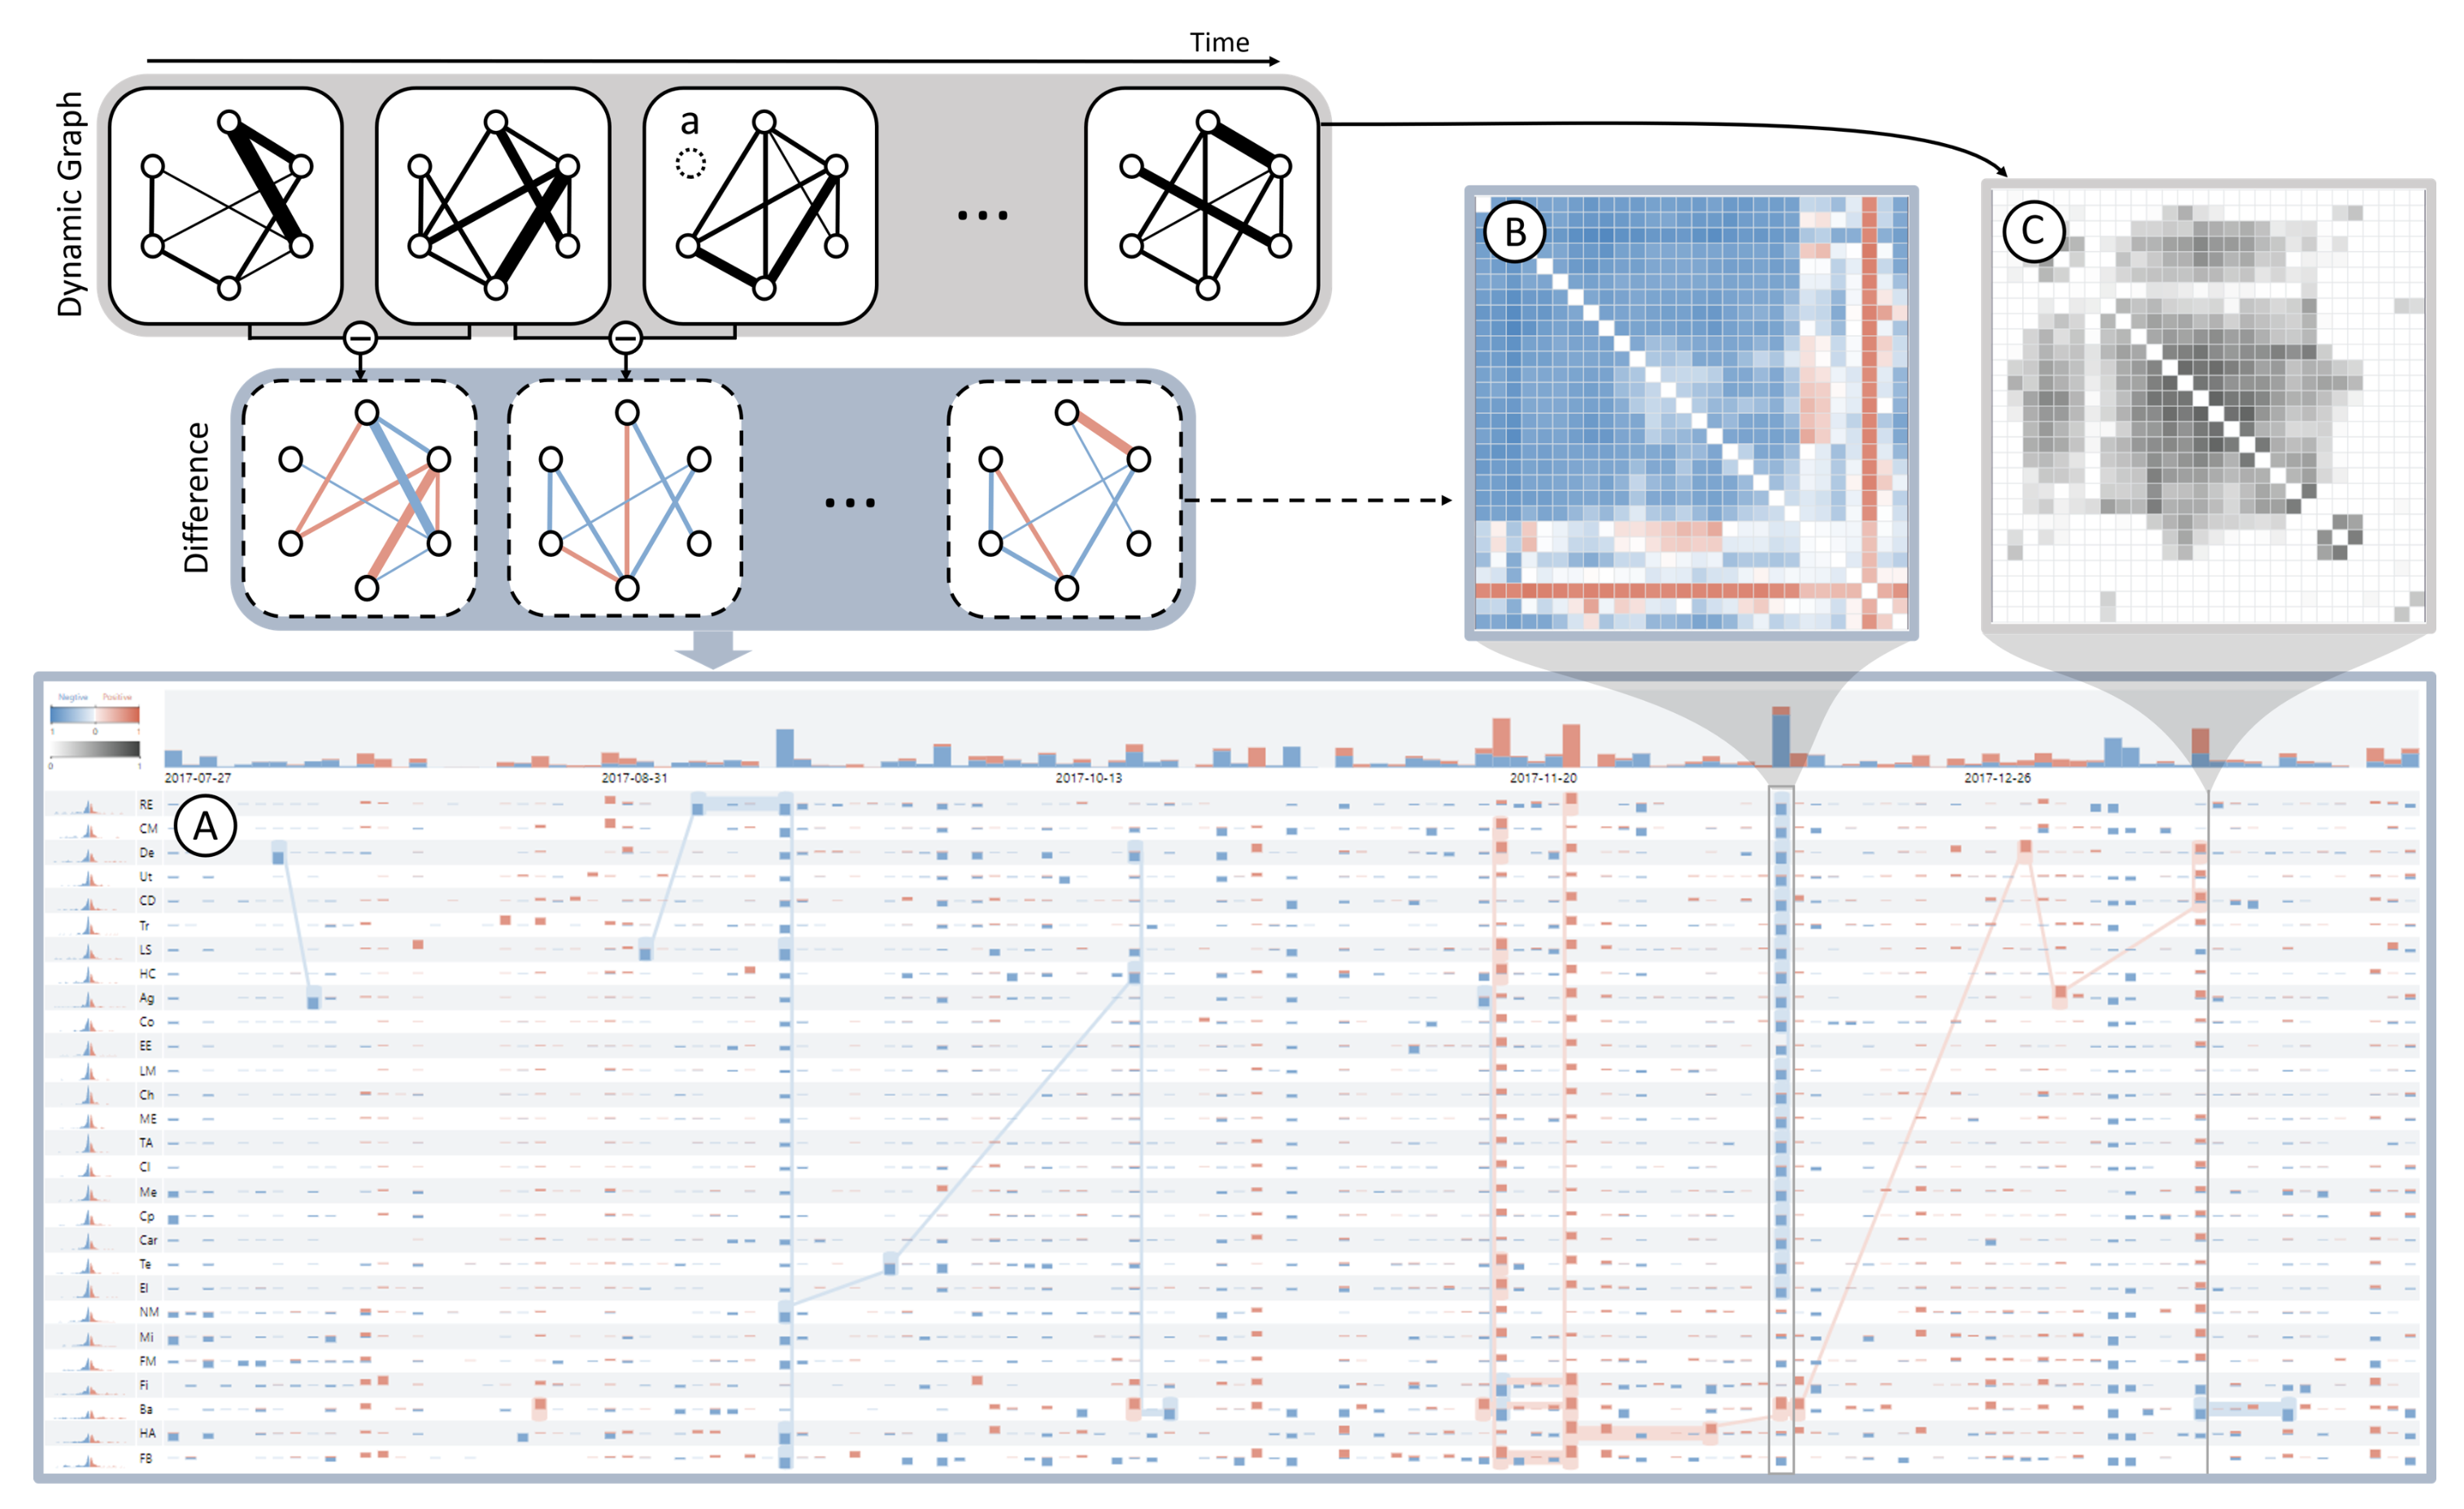
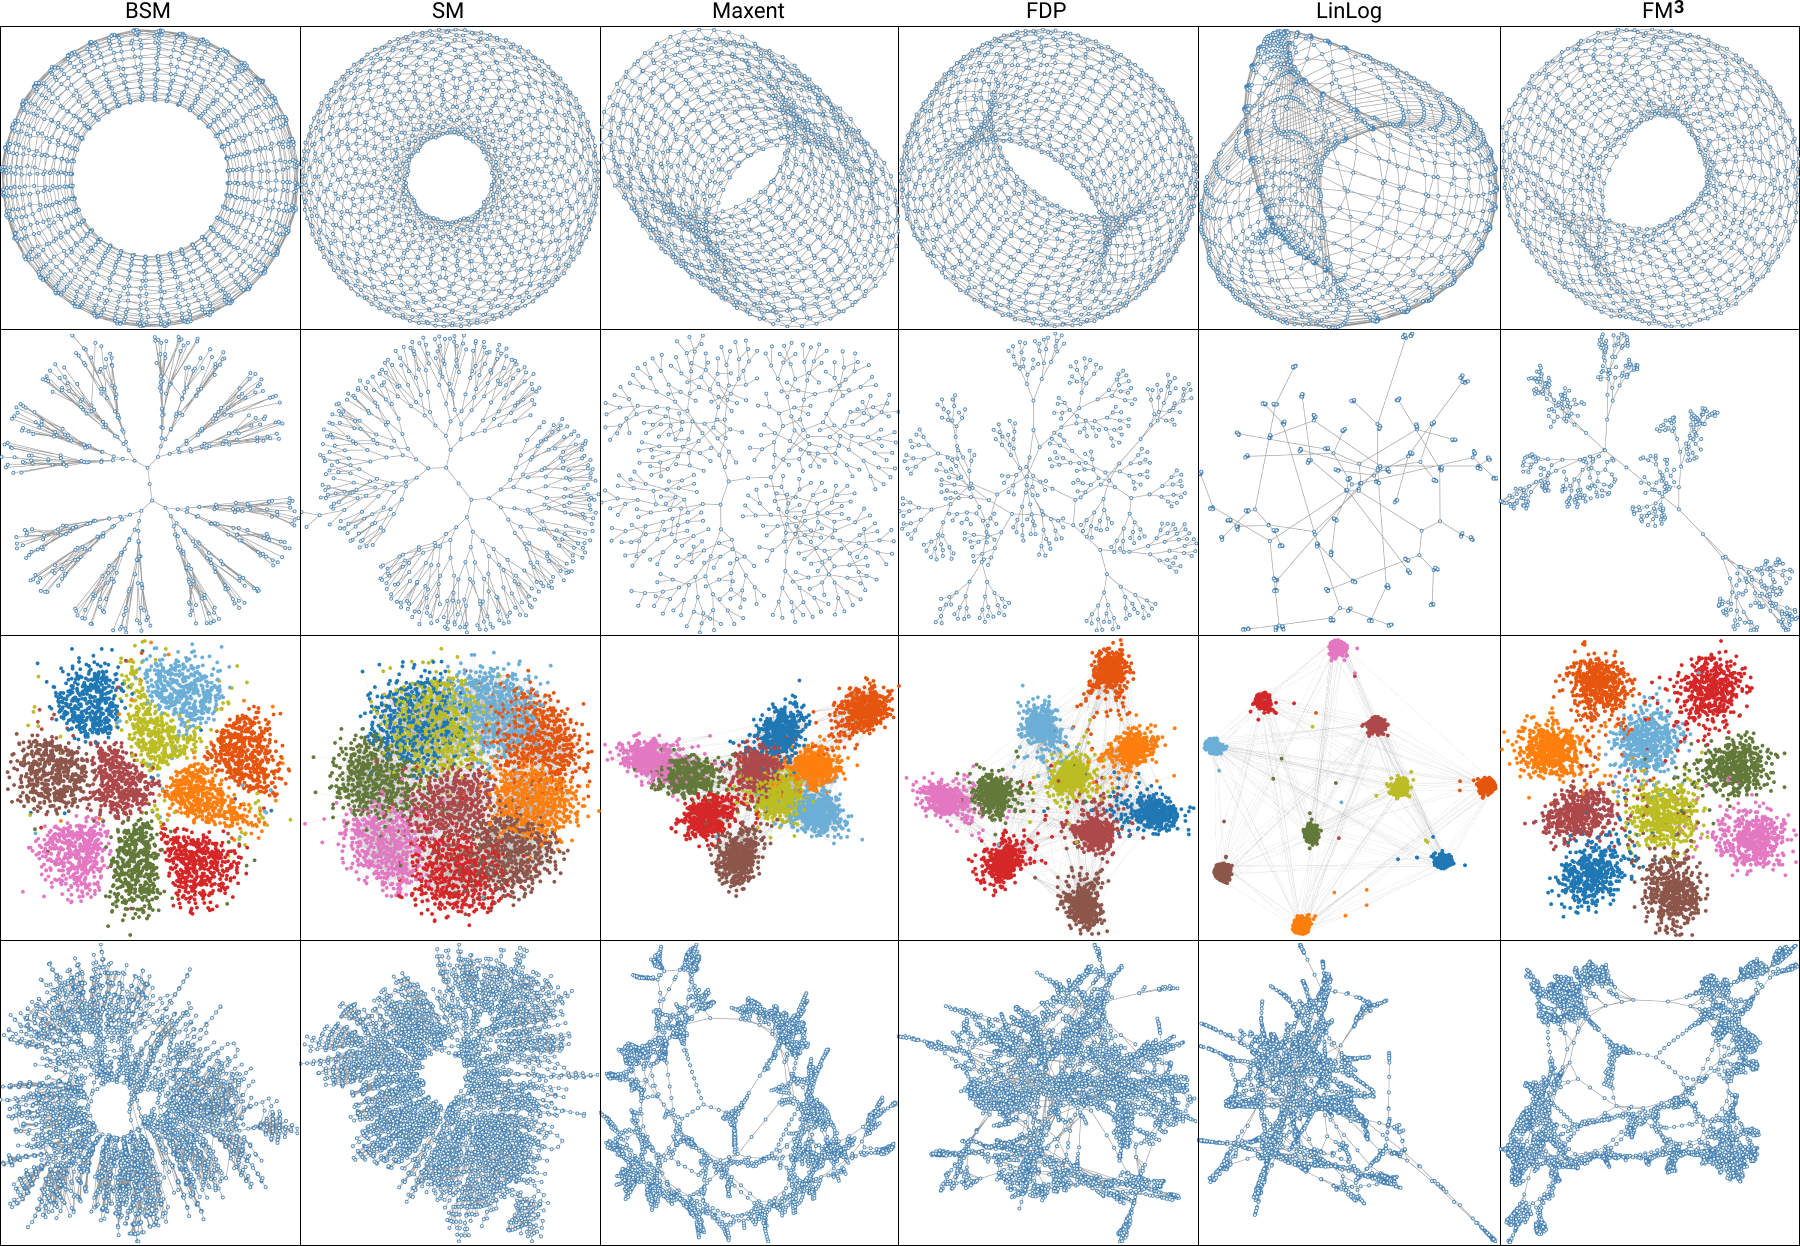
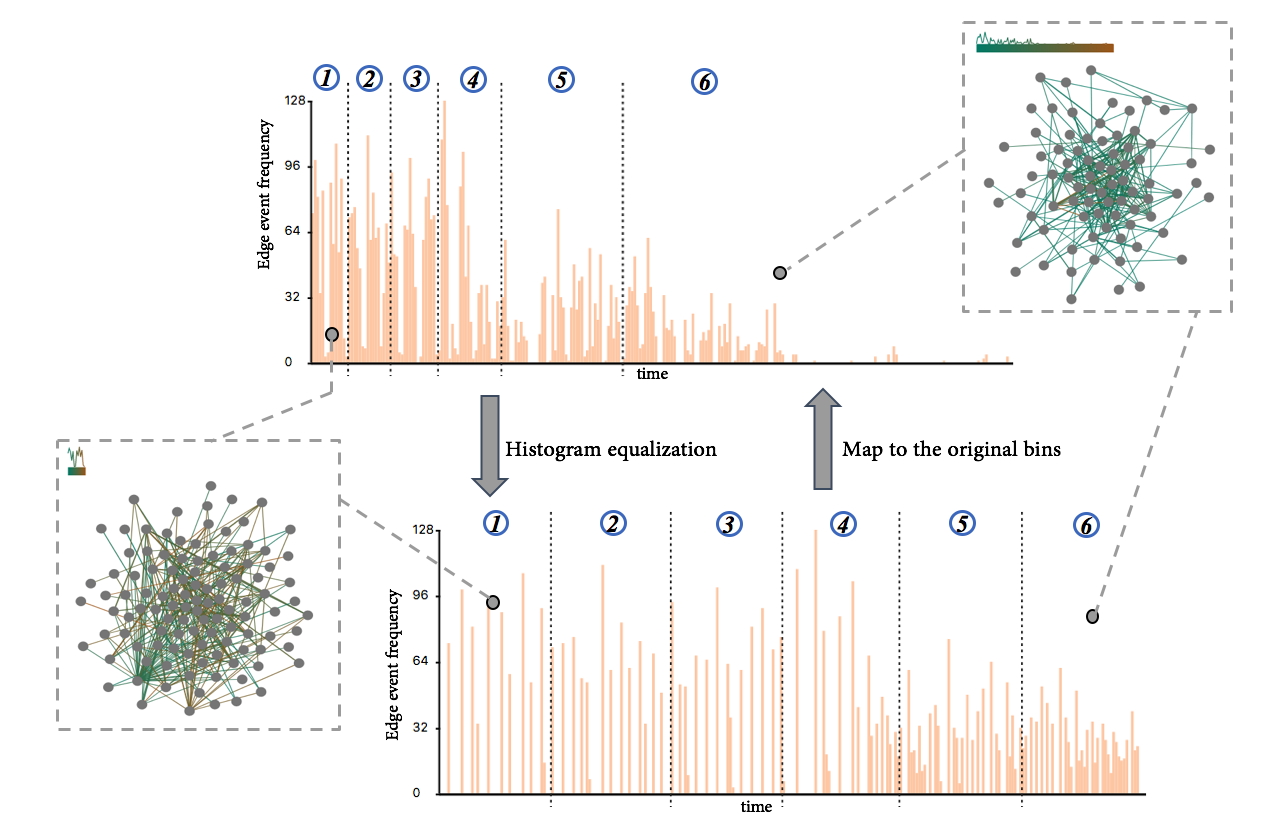
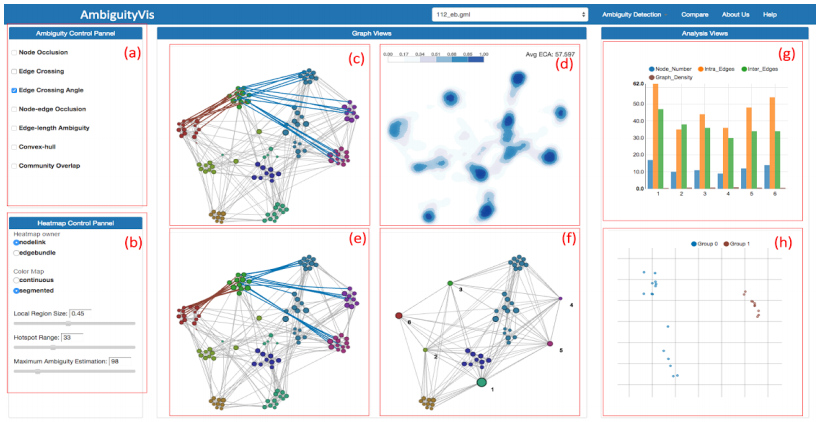
Graph visualization, also called graph drawing, mainly aims at designing layout algorithms and visual representations for networks, showing their global and local topological structures. It has been widely applied in various applications including social networks, biological networks, transportation systems, financial transaction networks, etc. Due to its significant importance, graph visualization has been extensively explored and is still under active research now. In the past few years, we have developed novel techniques to improve the visualizaton of both static and dynamic graphs. A few representative research outputs include convenient assessment of graph drawing amabiguity, deep-learning-based evaluation of graph drawing readability, non-uniform timeslicng for dynamic graph visualization and a vector field design approach for animated transition.

Visual Analytics for Critical Applications
Quantum Computing
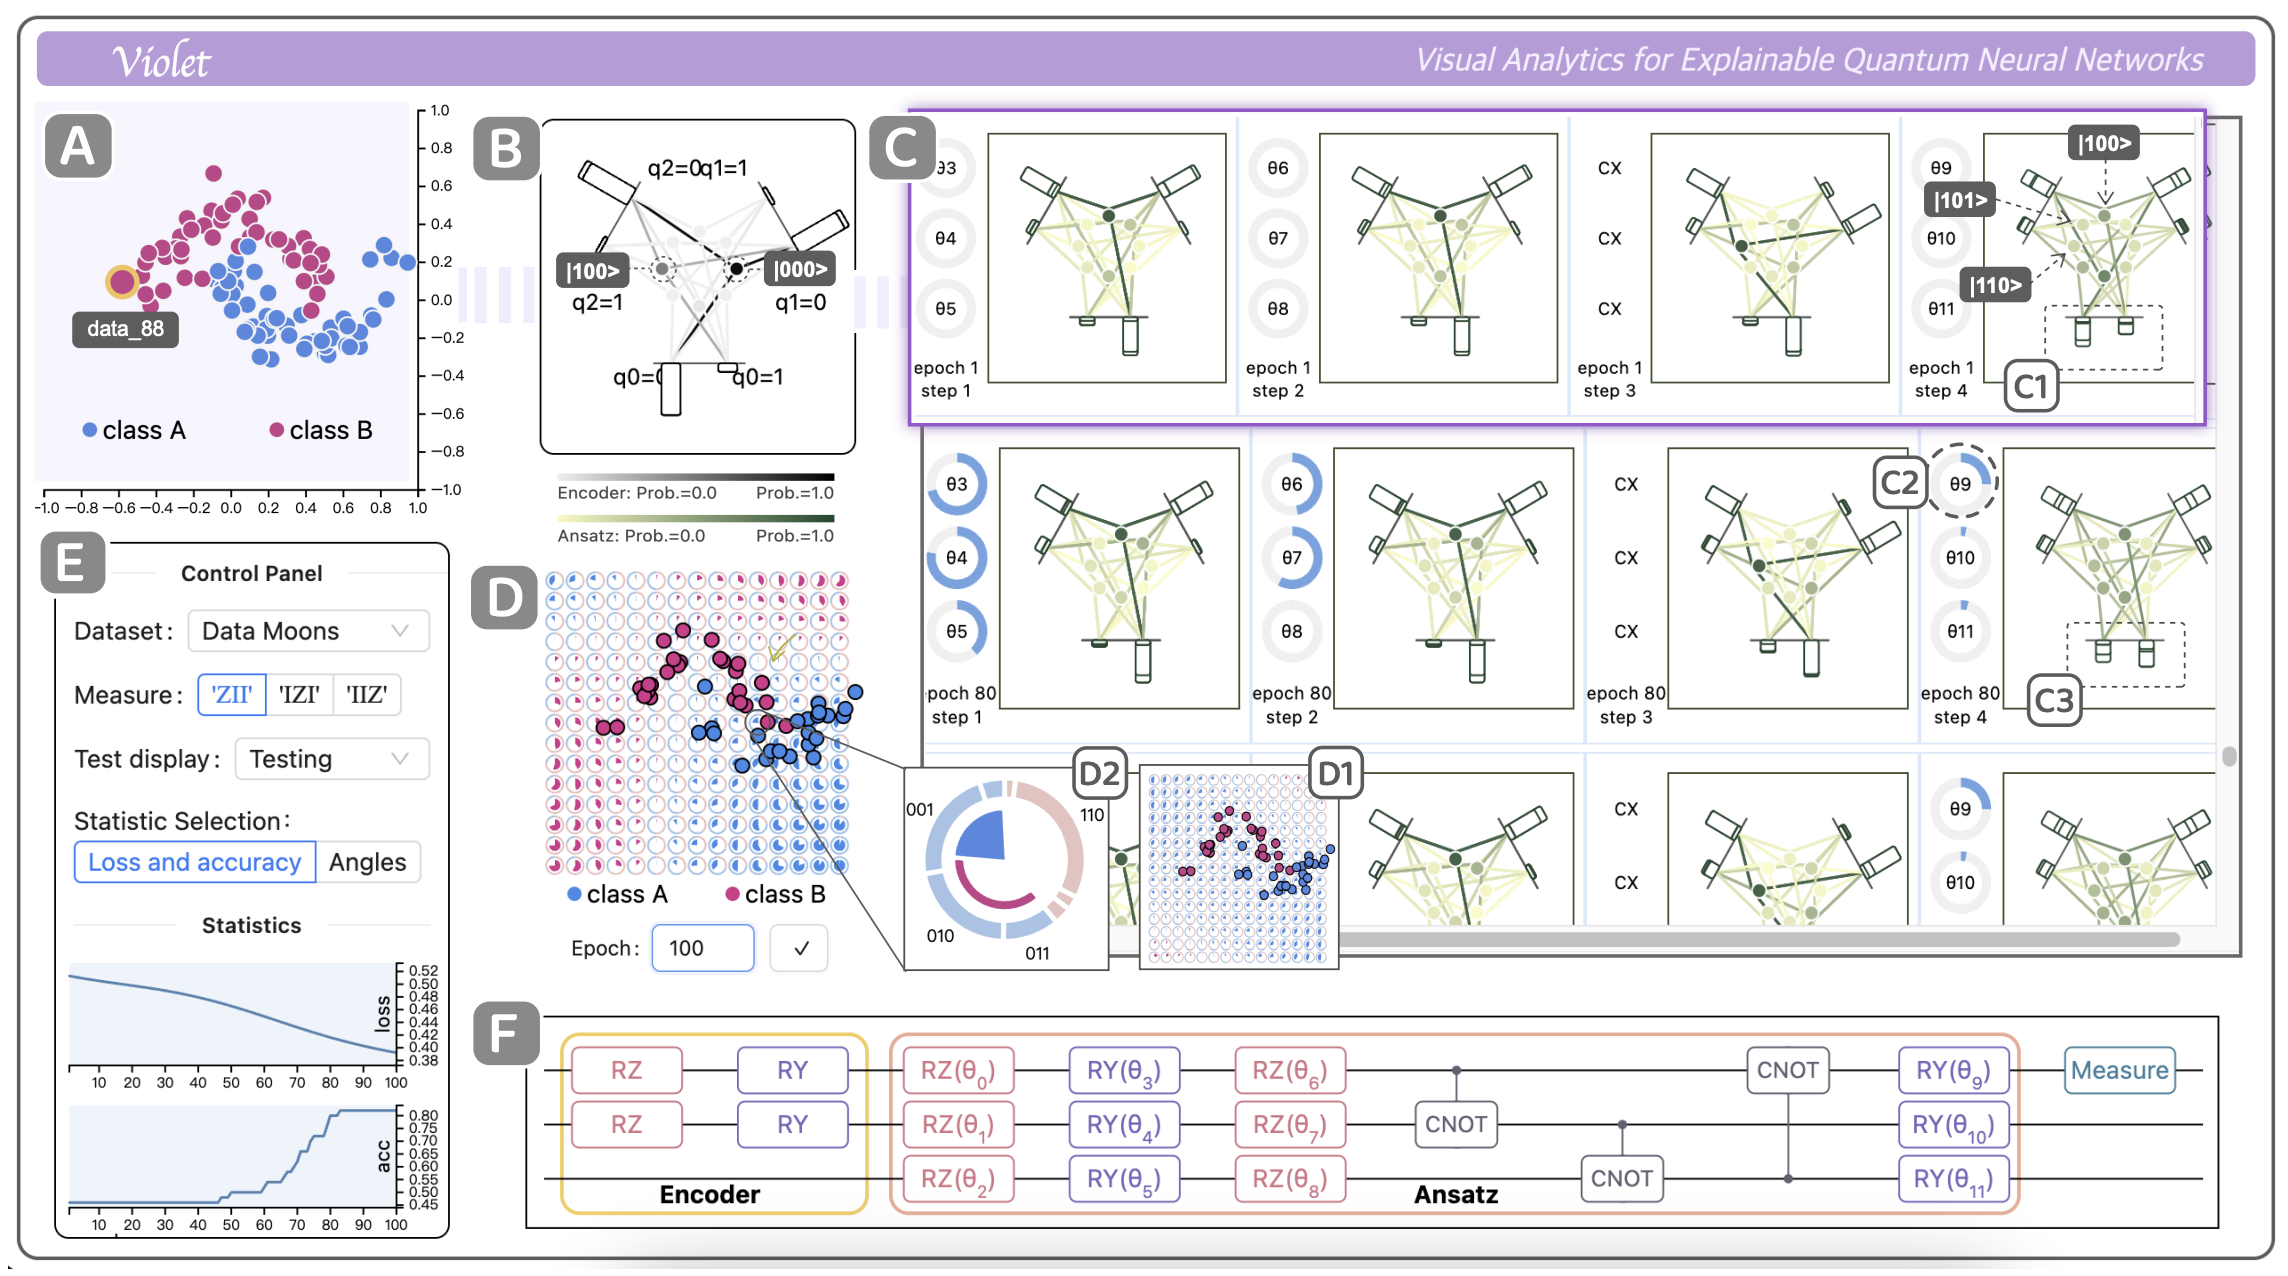
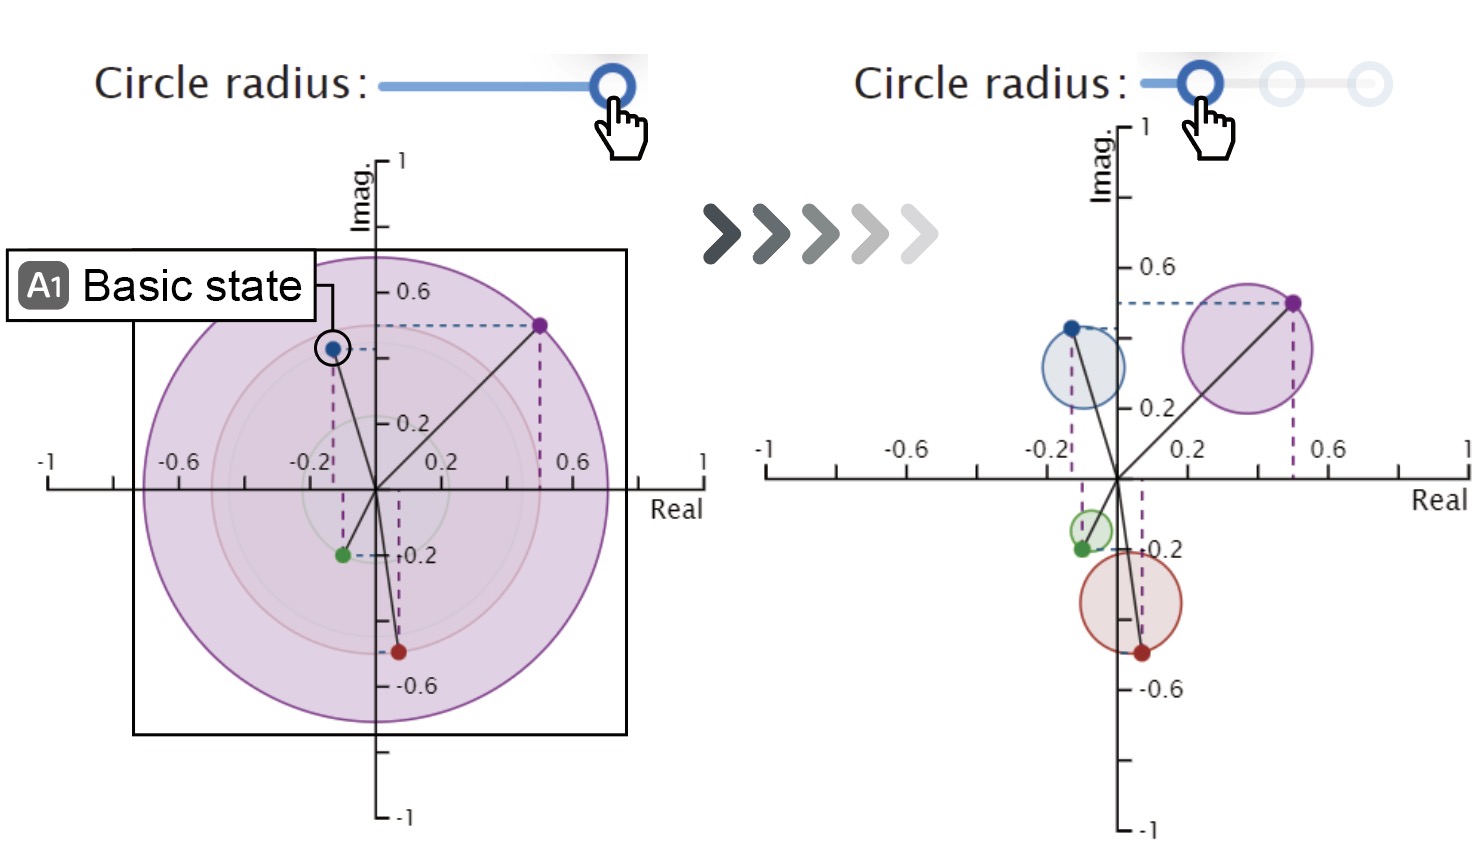
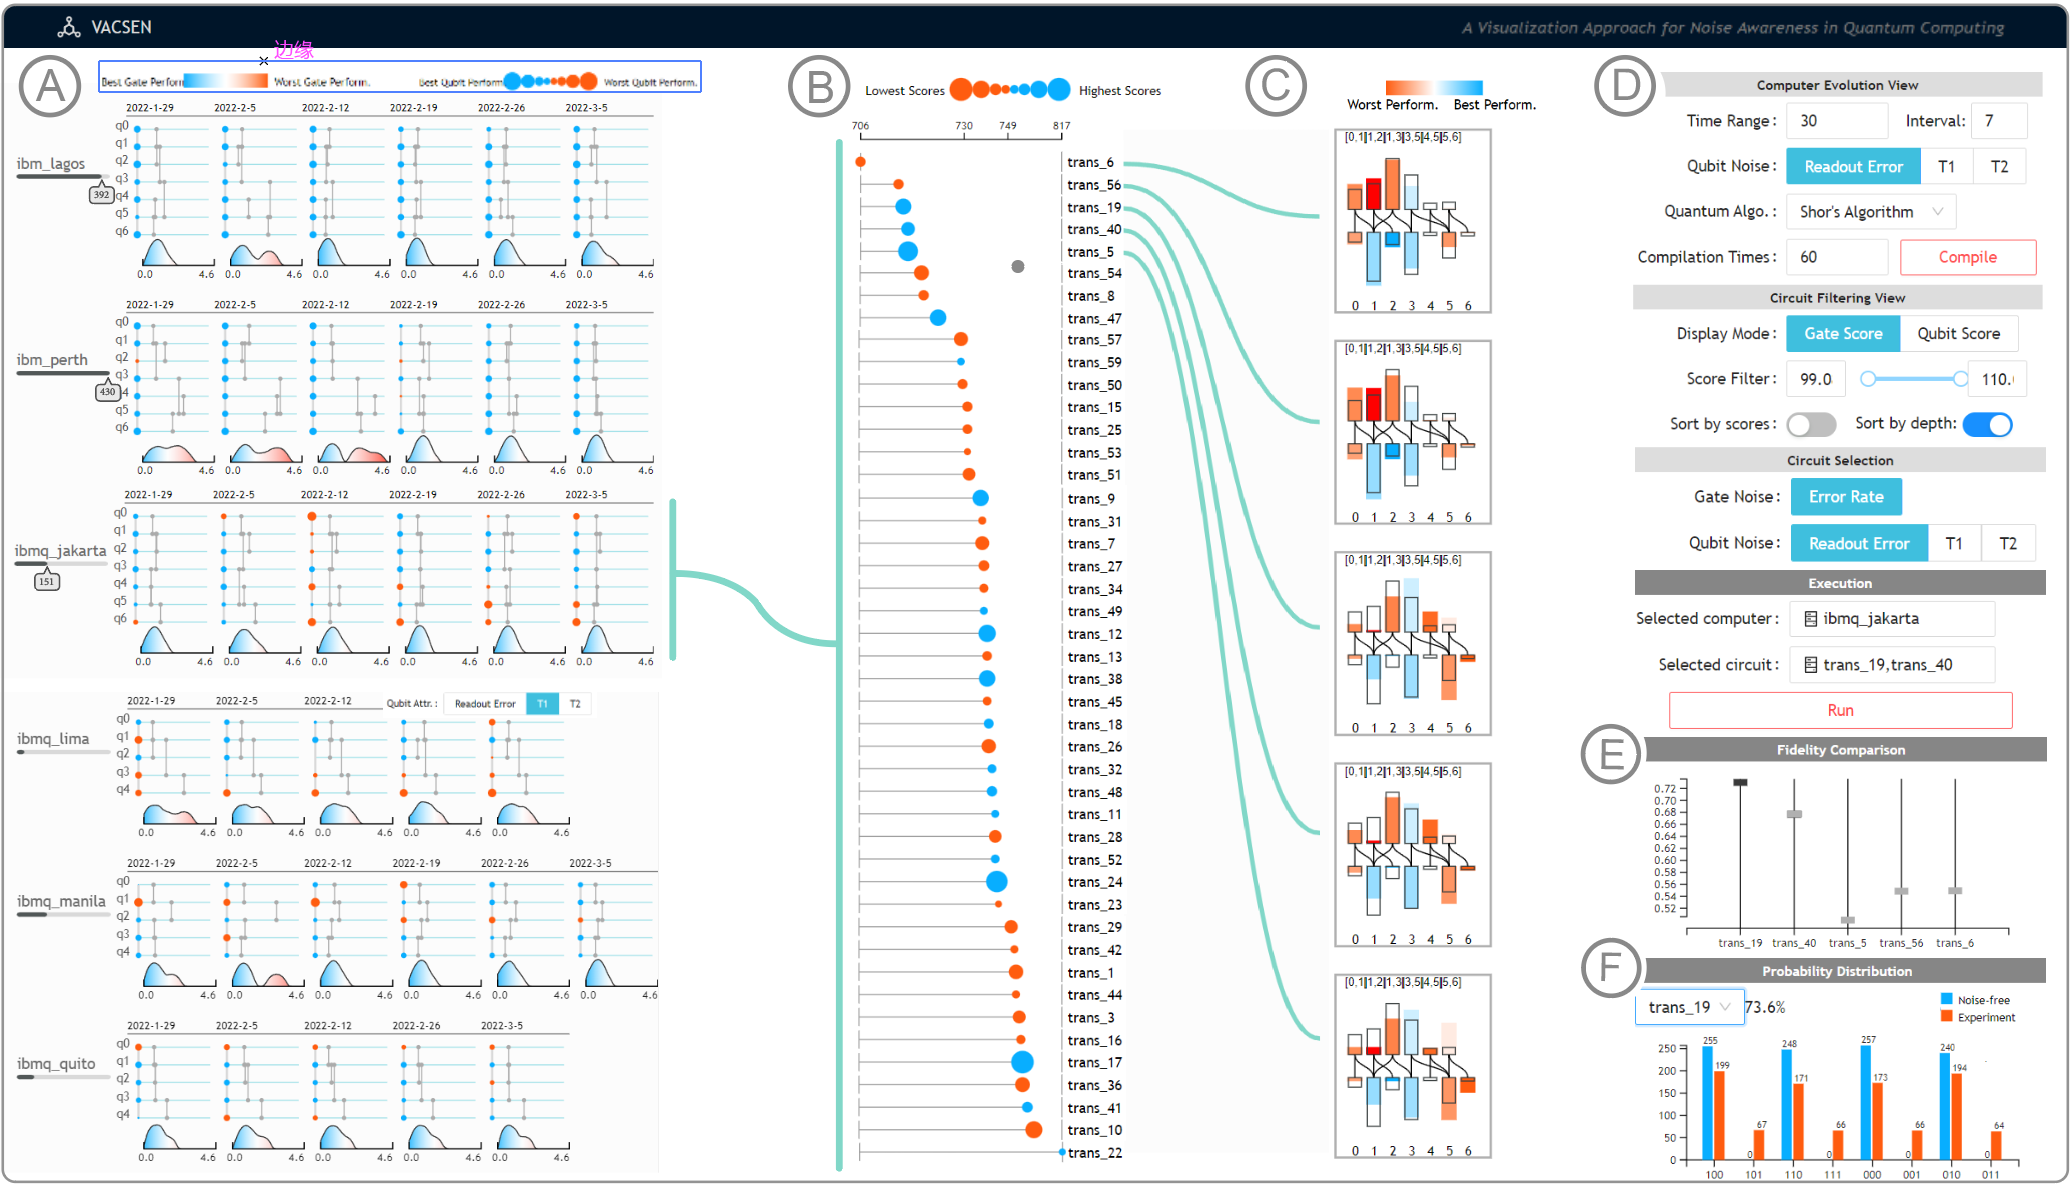
Quantum computing has experienced remarkable advancements in recent years. The rapid evolution of quantum computers by leading IT companies, like Google, IBM, D-Wave and Rigetti, is making the potential quantum advantages increasingly realistic. Different nations, including the USA, European Union, China, Canada, UK and Australia, have invested huge resources in quantum computing. Despite the potential quantum advantage, it is challenging for non-experts to understand the abstract concepts in quantum computing. We aim to develop novel visual analytics approaches to help both professional developers and common learners of quantum computing easily understand, learn and develop quantum computing algorithms. We strive to speed up the quantum computing development from the perspective of data visualization and HCI.
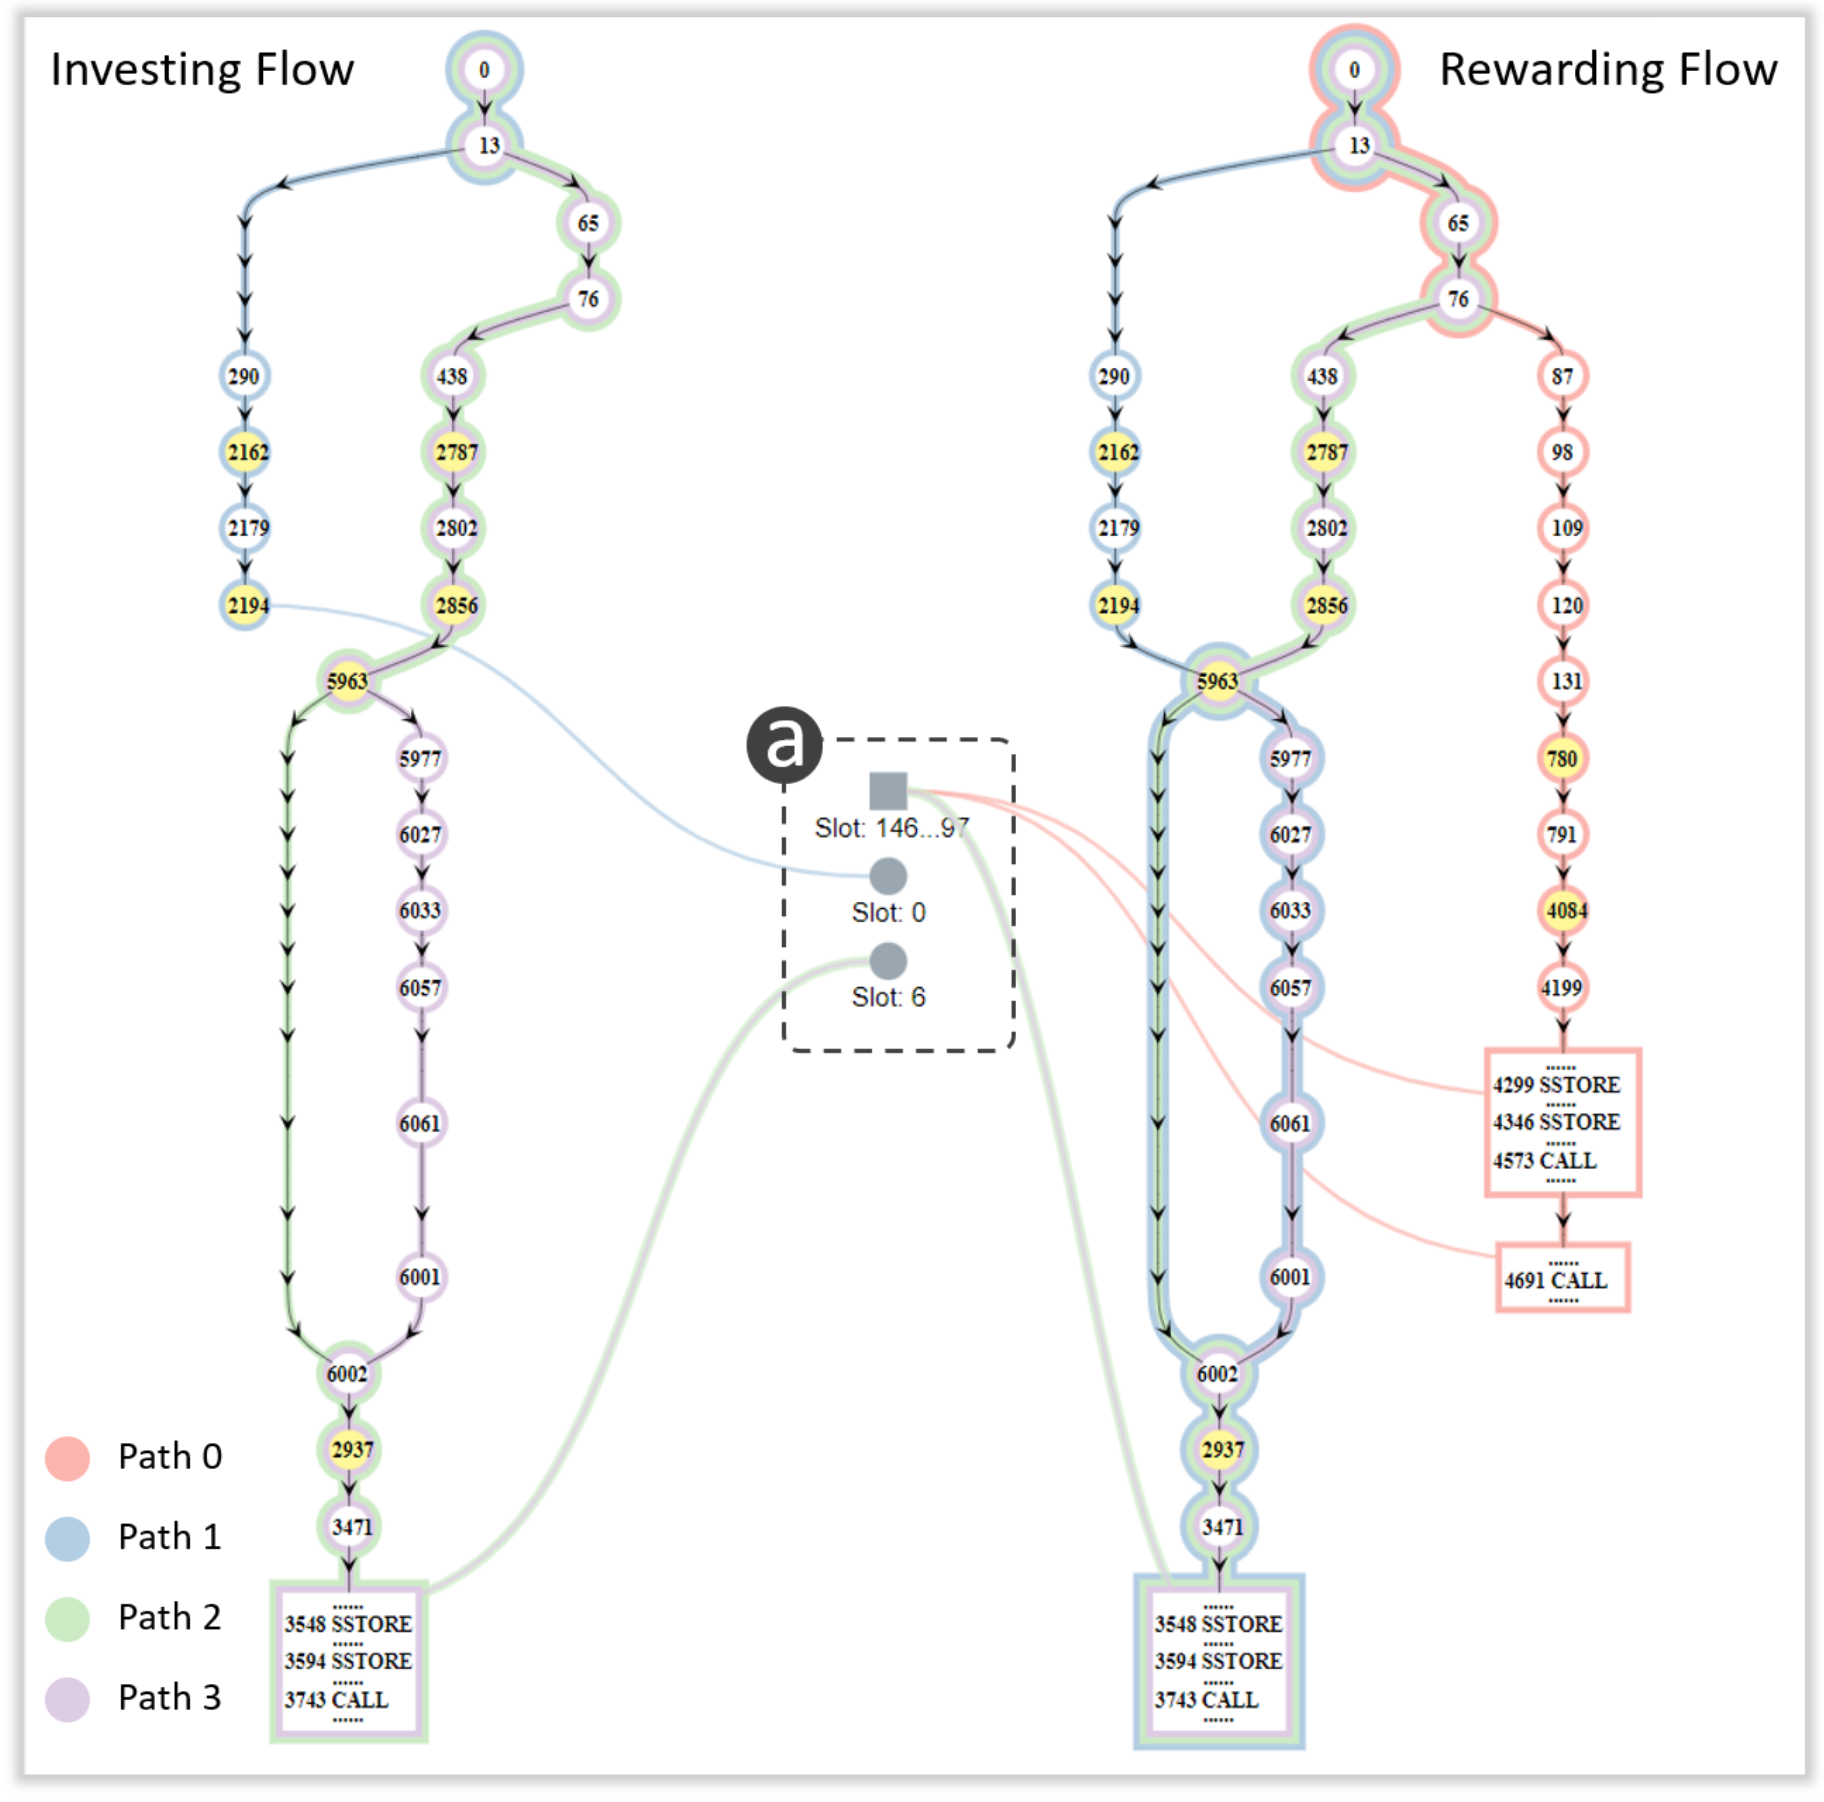
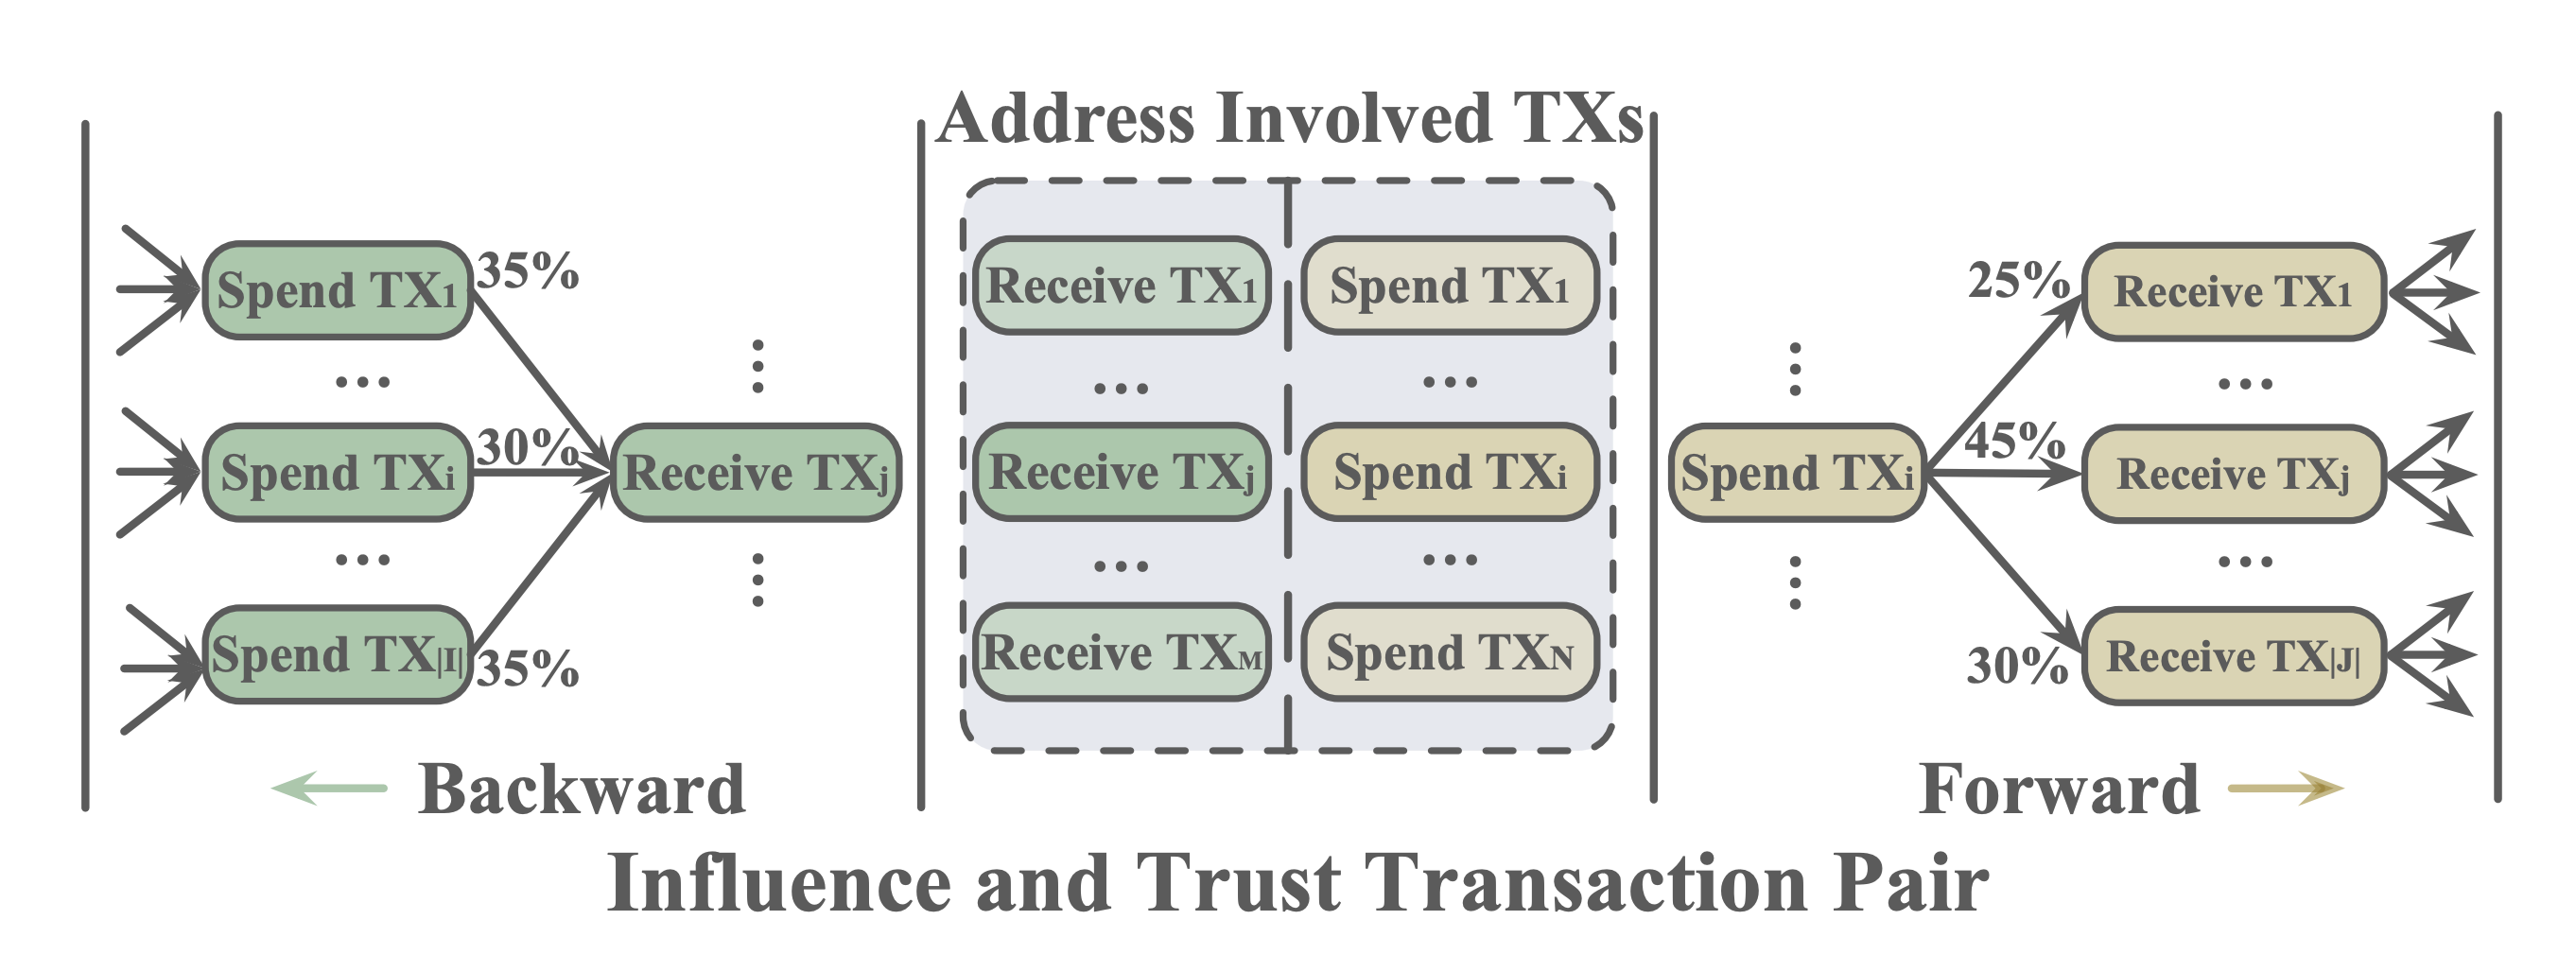
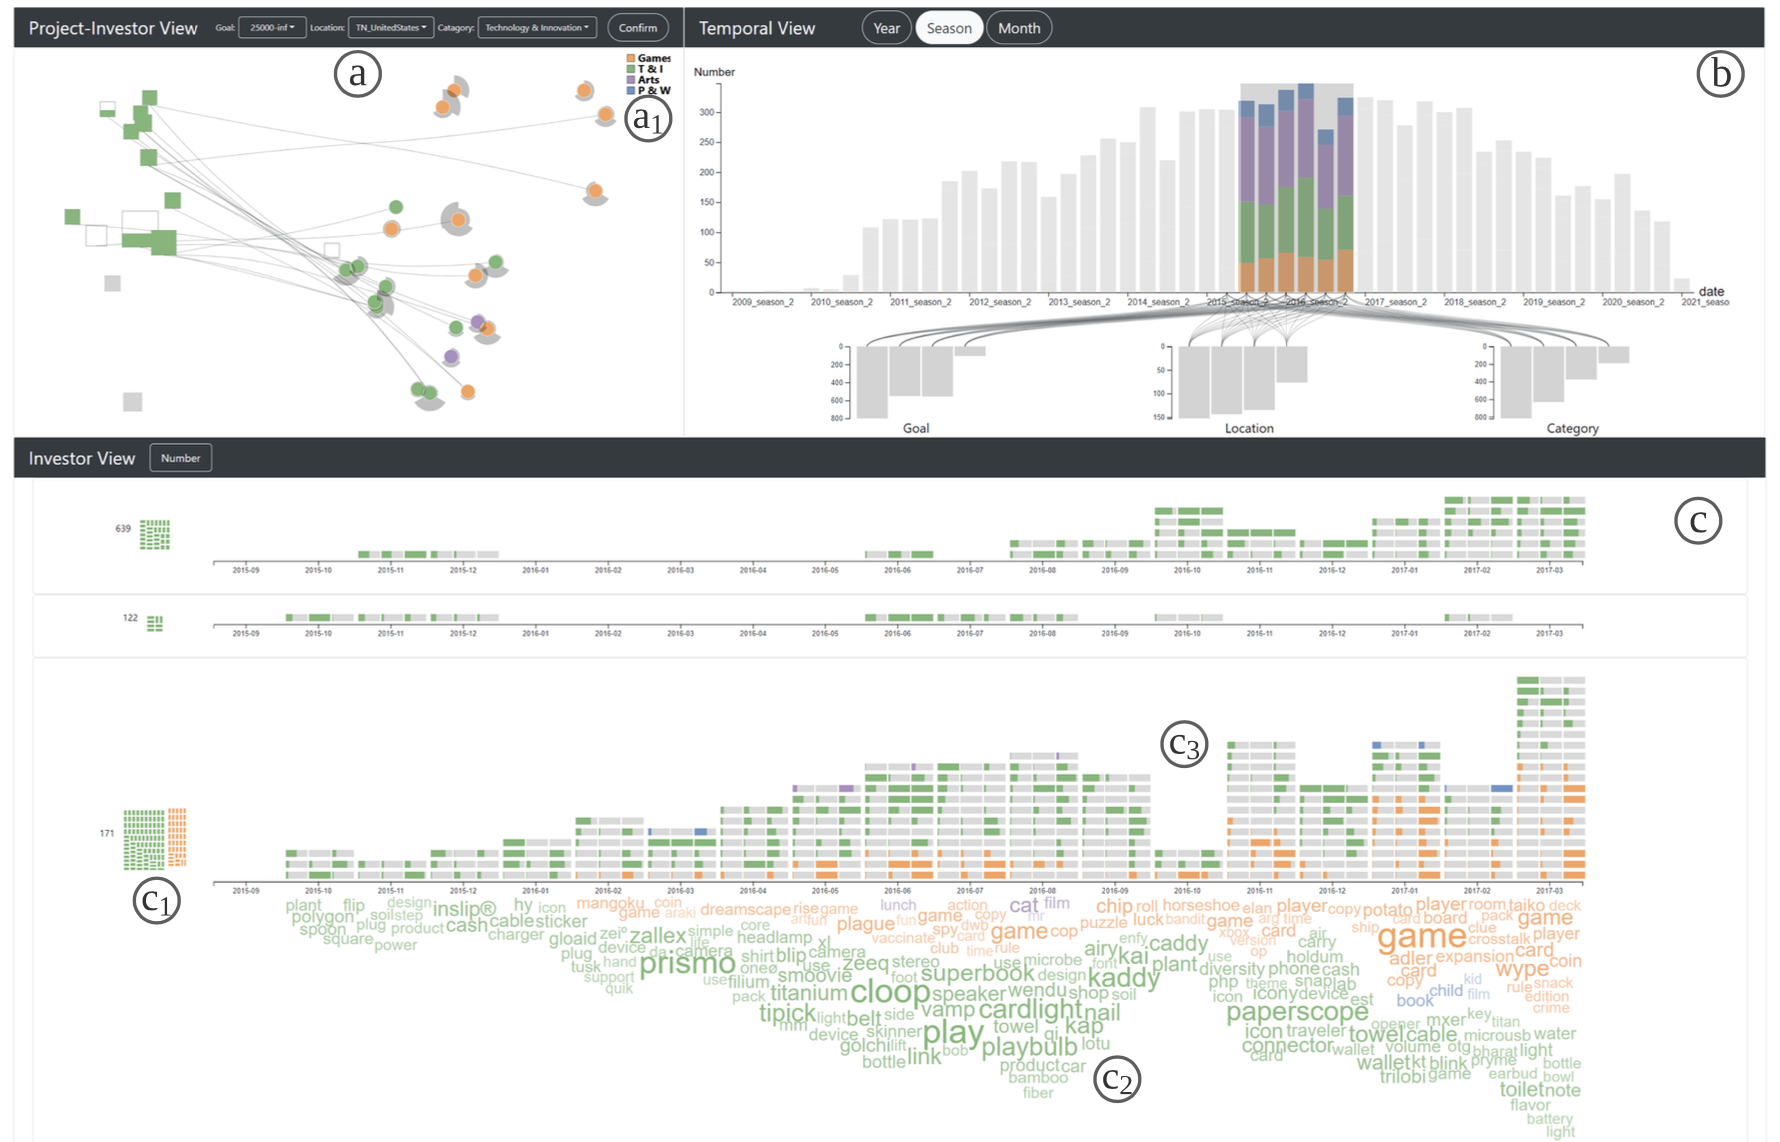
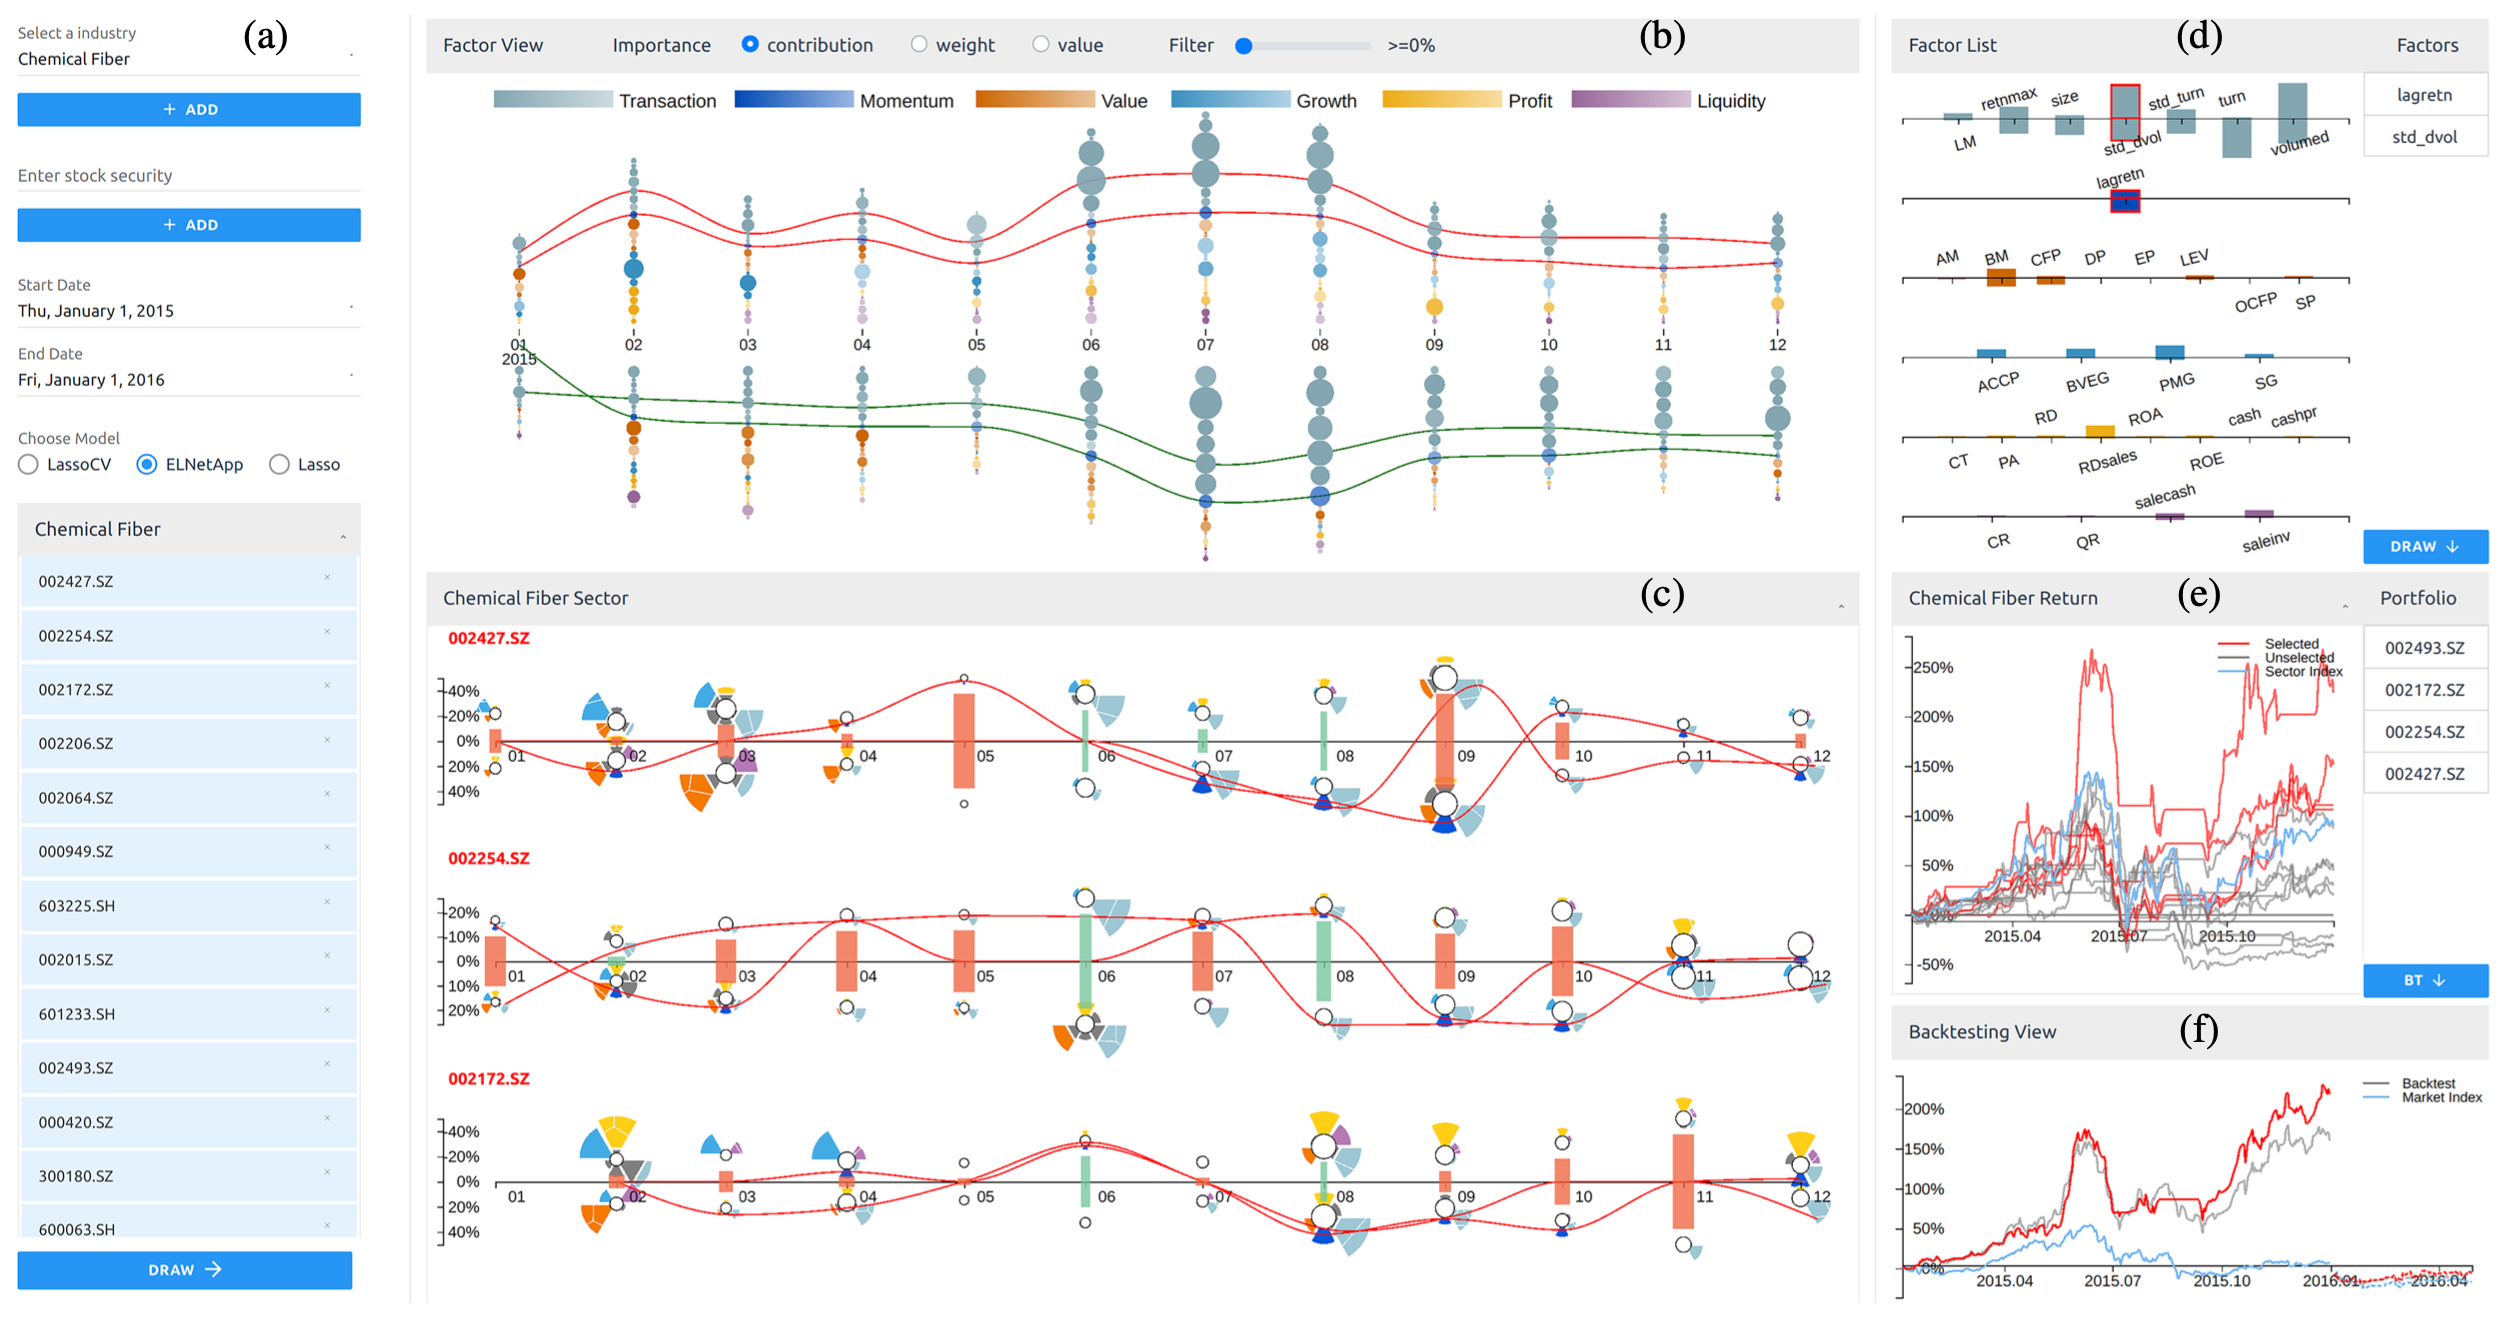
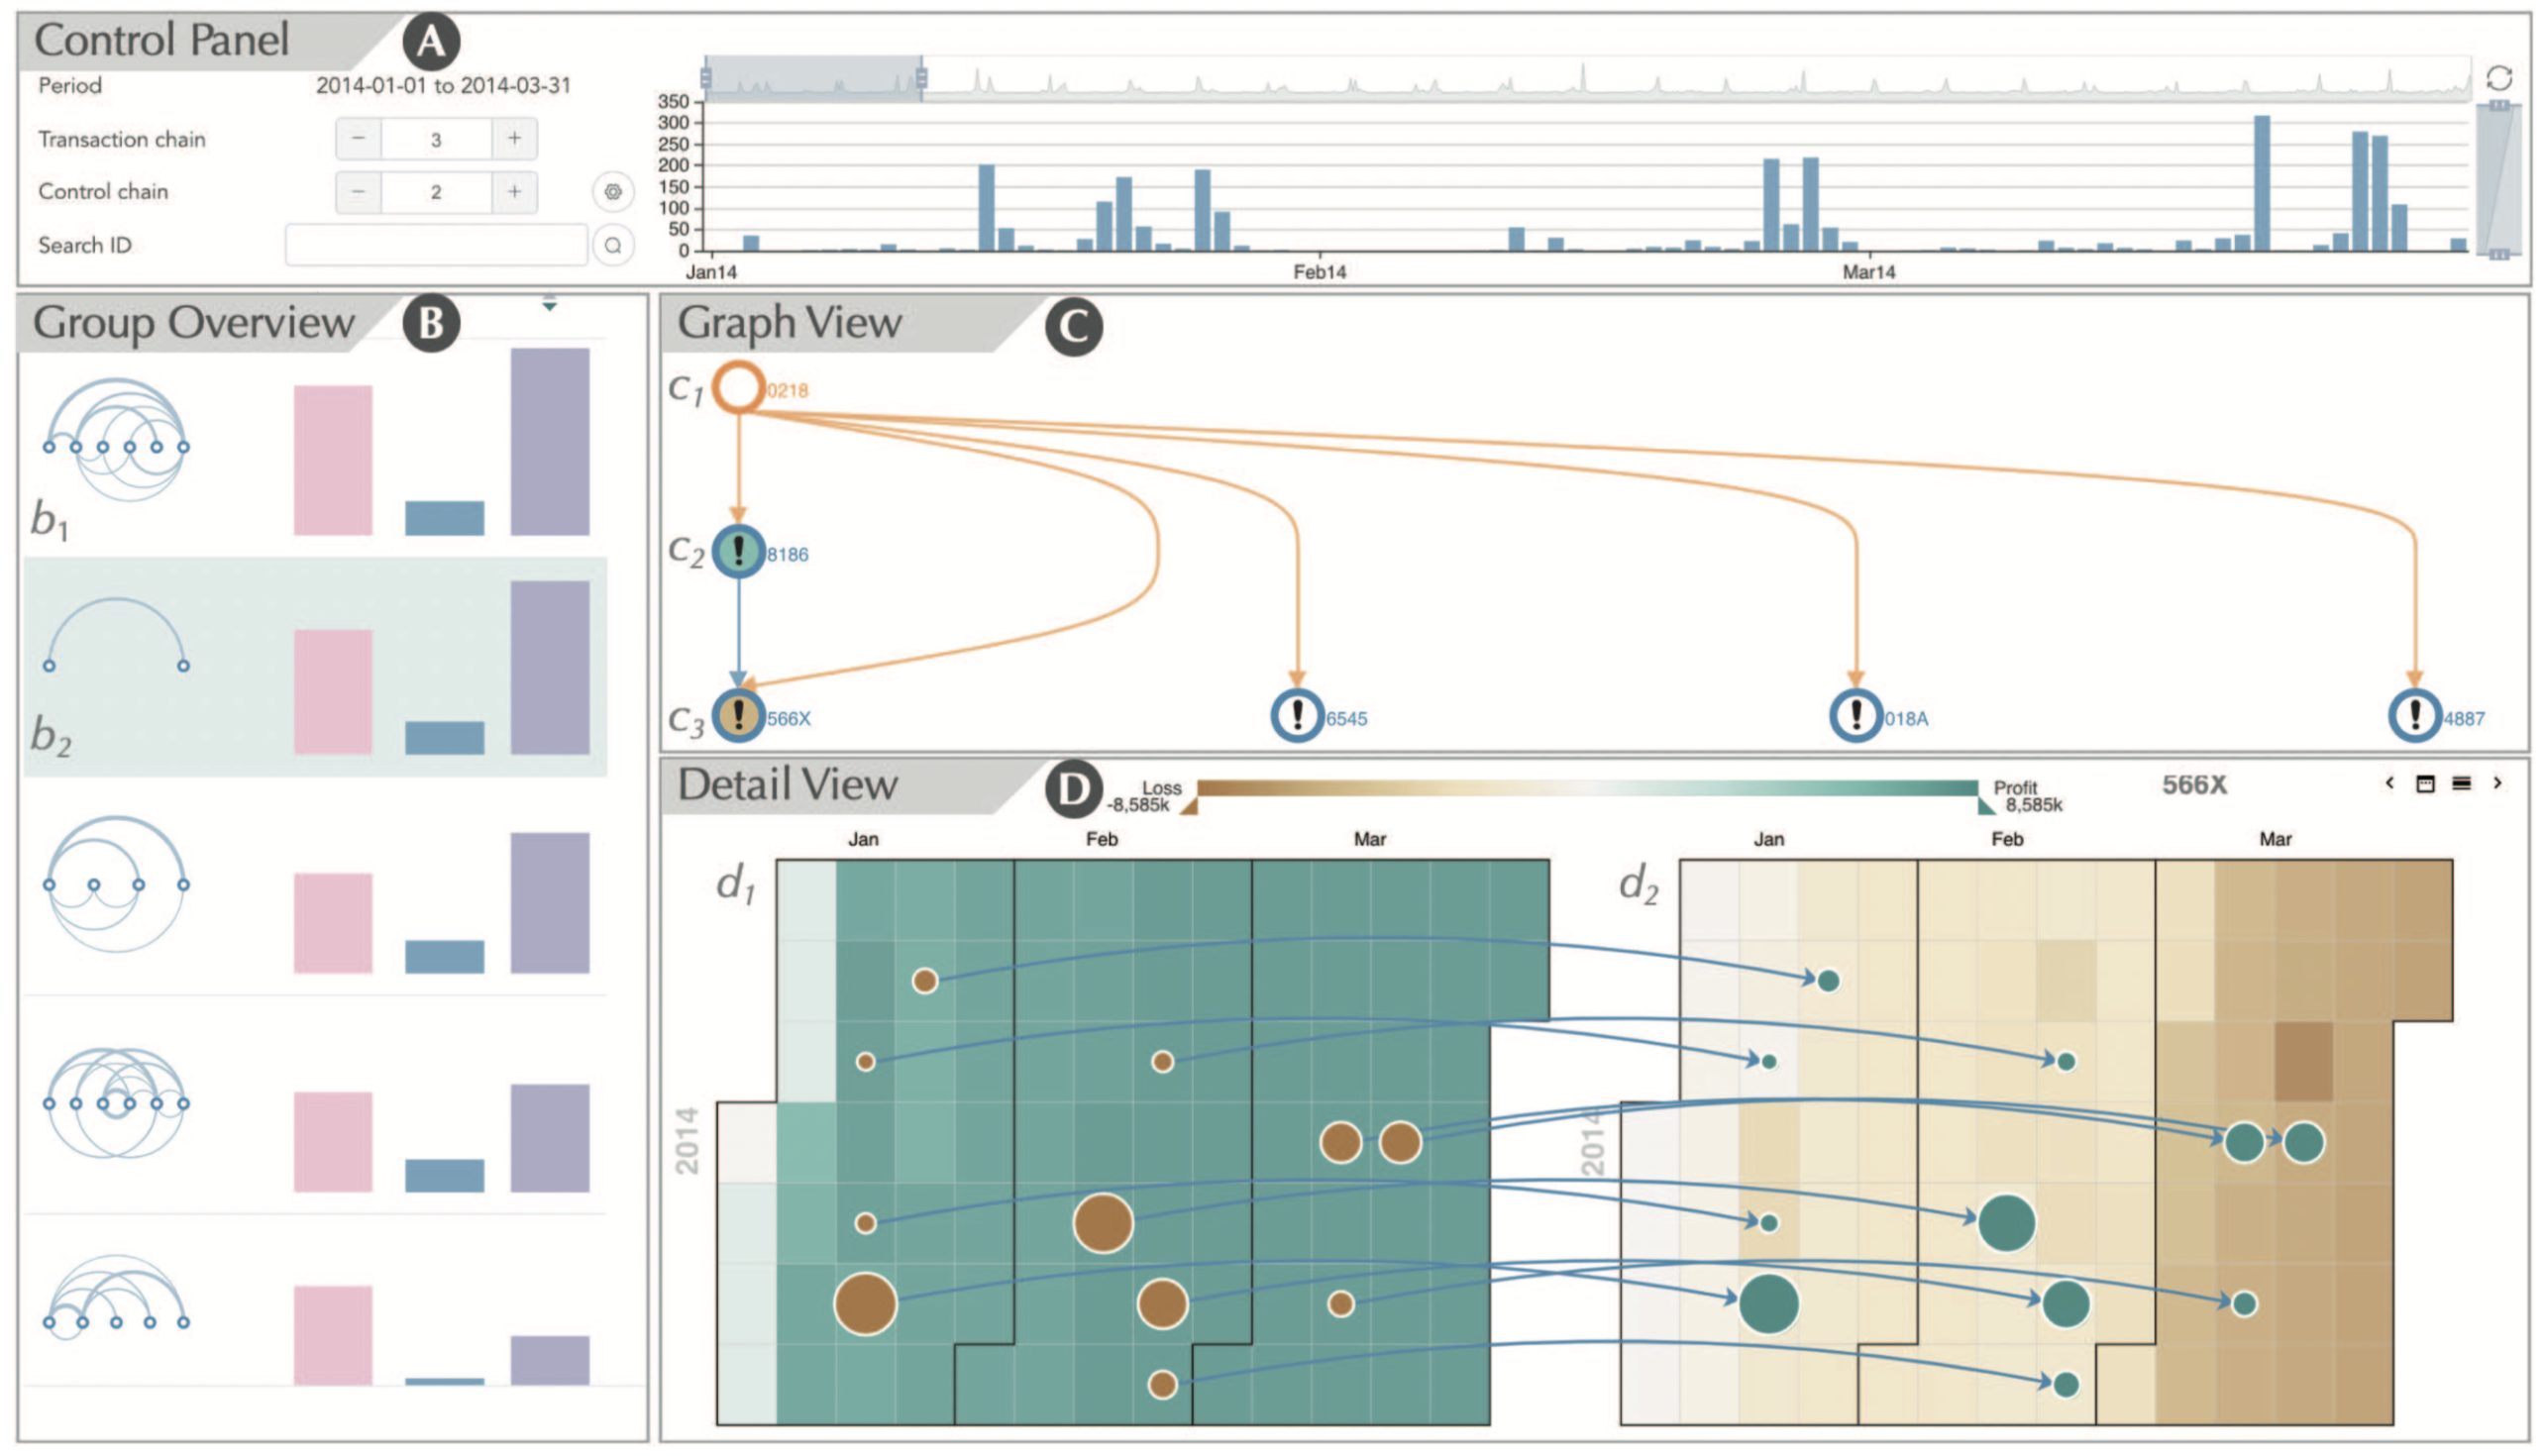
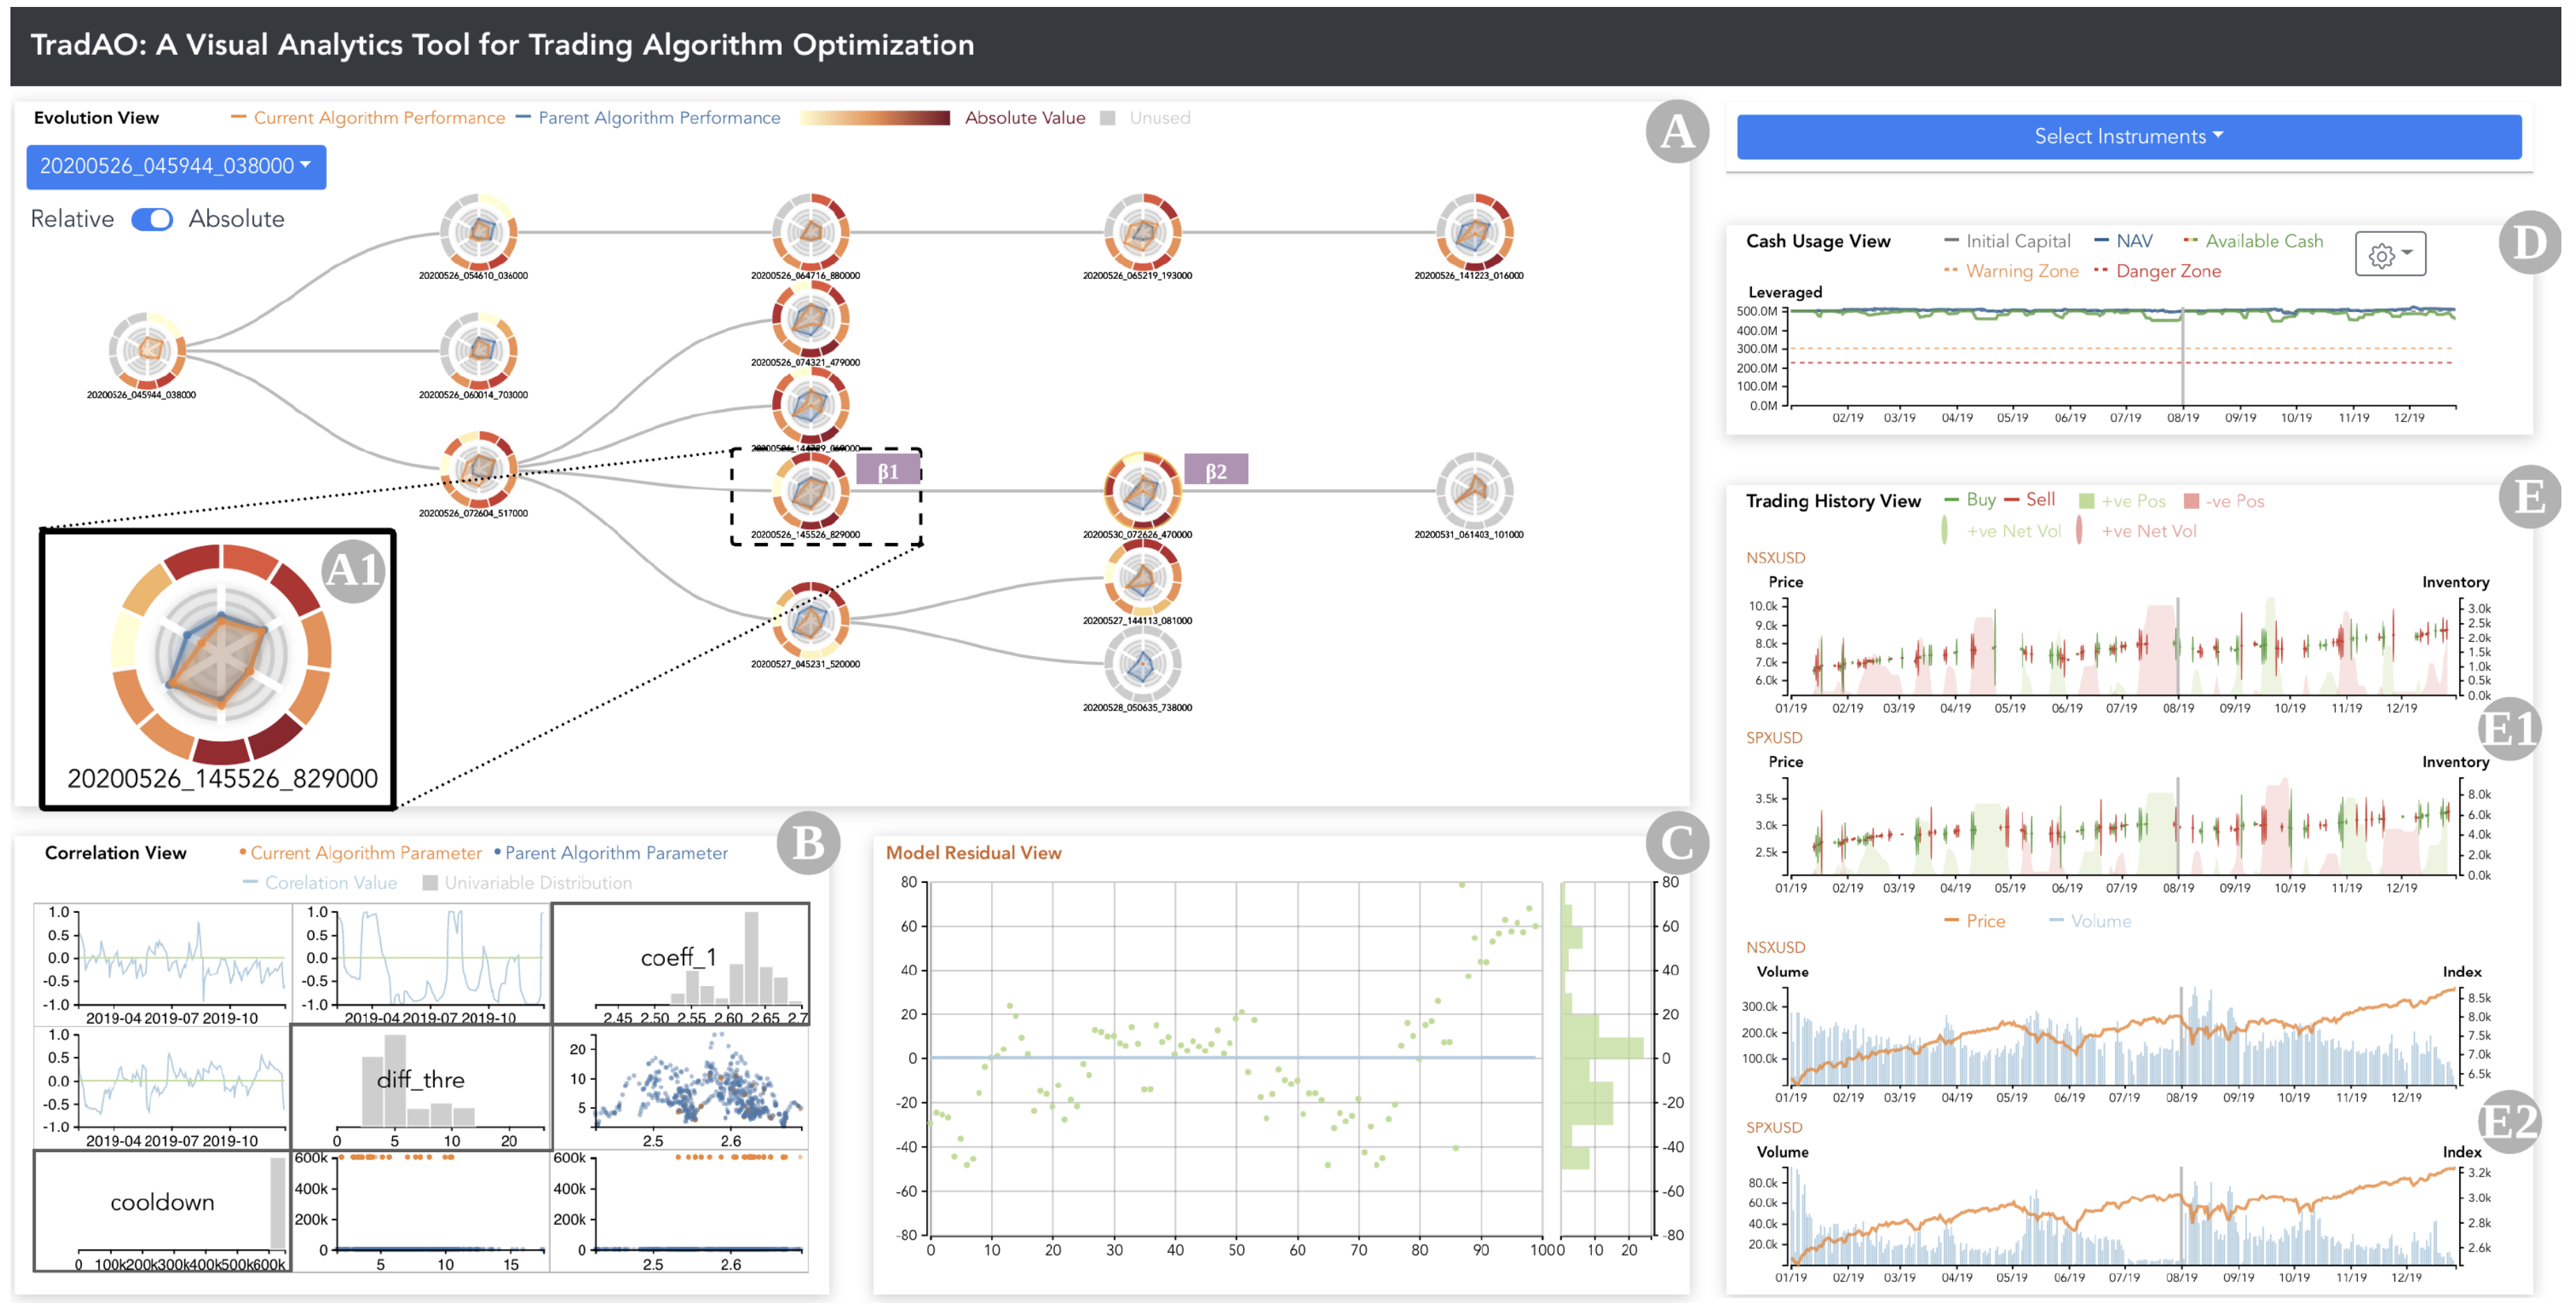
FinTech
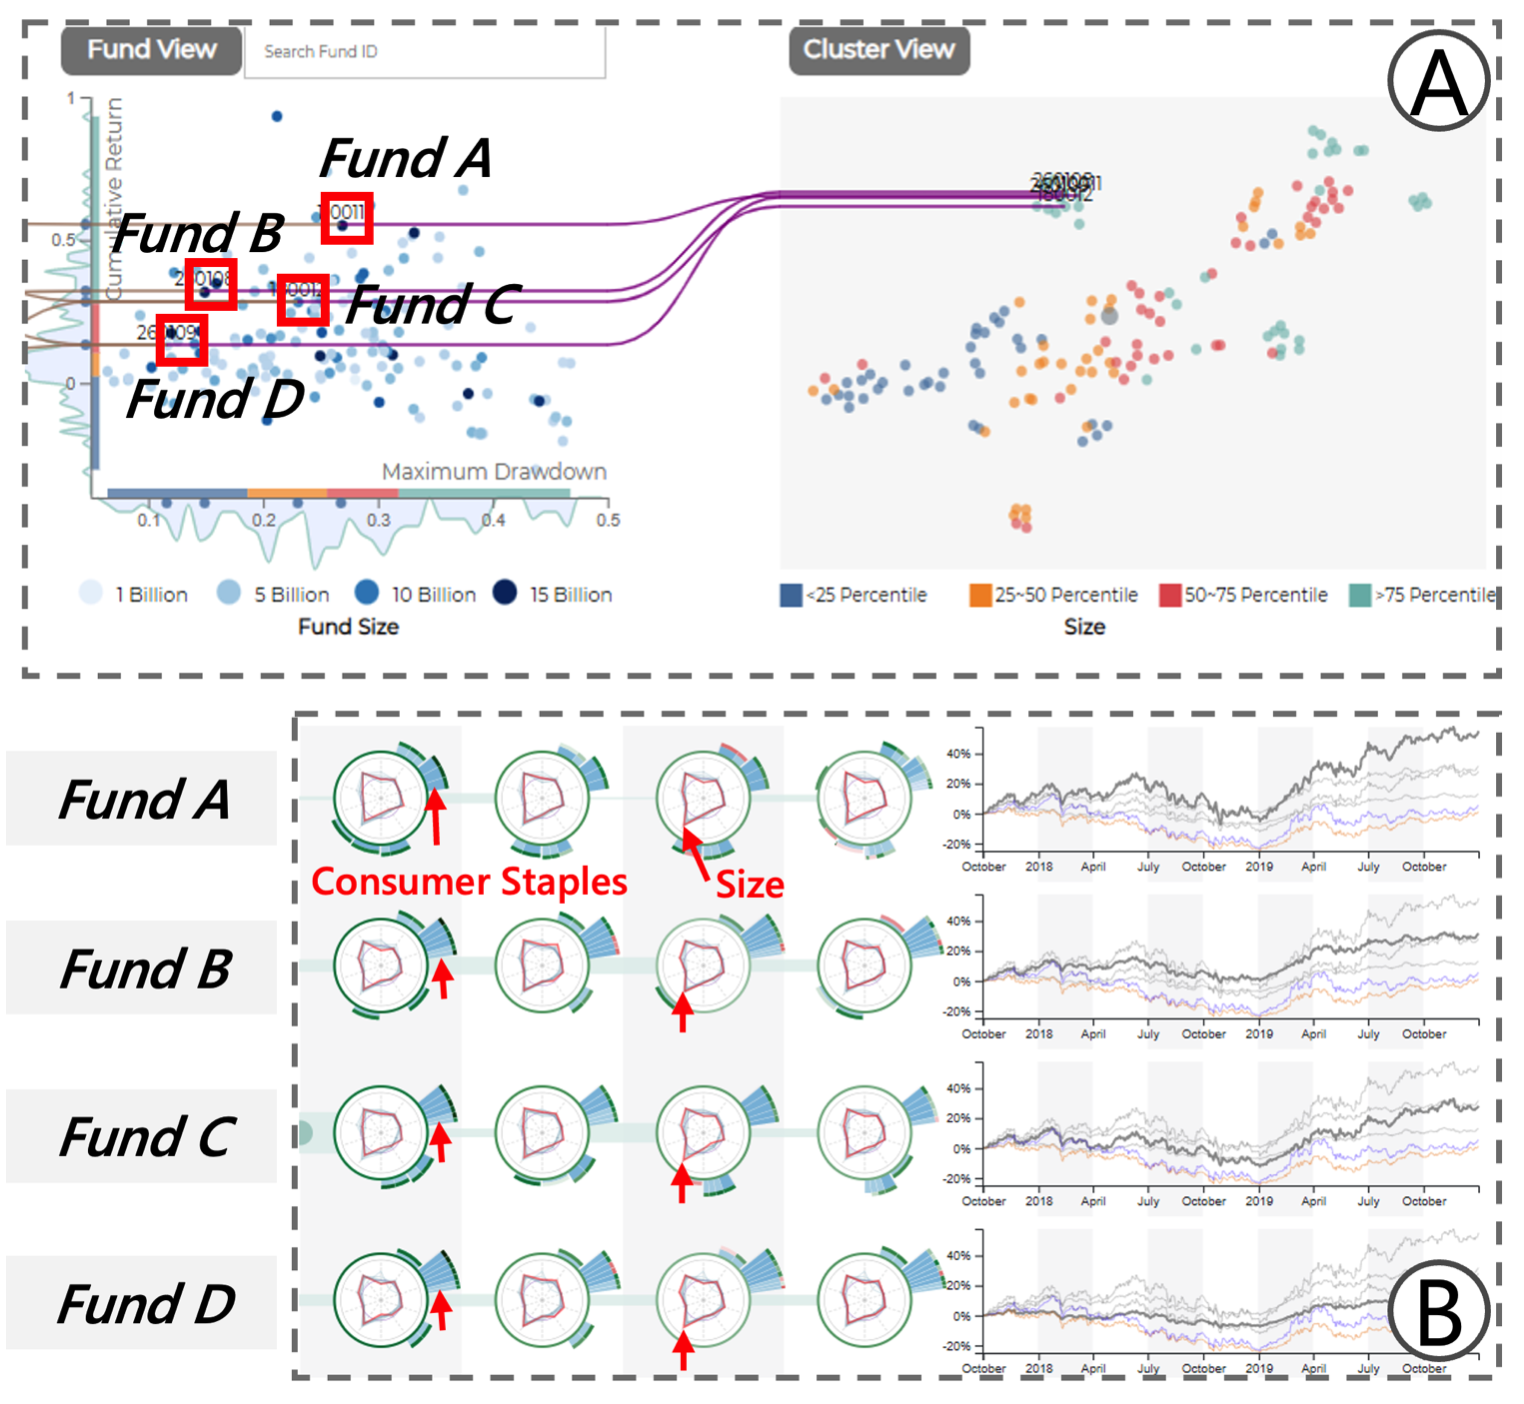
According to wikipedia, "Financial technology (FinTech) is the technology and innovation that aims to compete with traditional financial methods in the delivery of financial services". There has been an increasing trend in the industry in the past decade to explore how technology can improve activities in finance. We conducted preliminary studies on developing interactive visual analytics techniques to benefit the finance-related regulations and services, including suspicious tax evasion group detection and trading algorithm optimization.


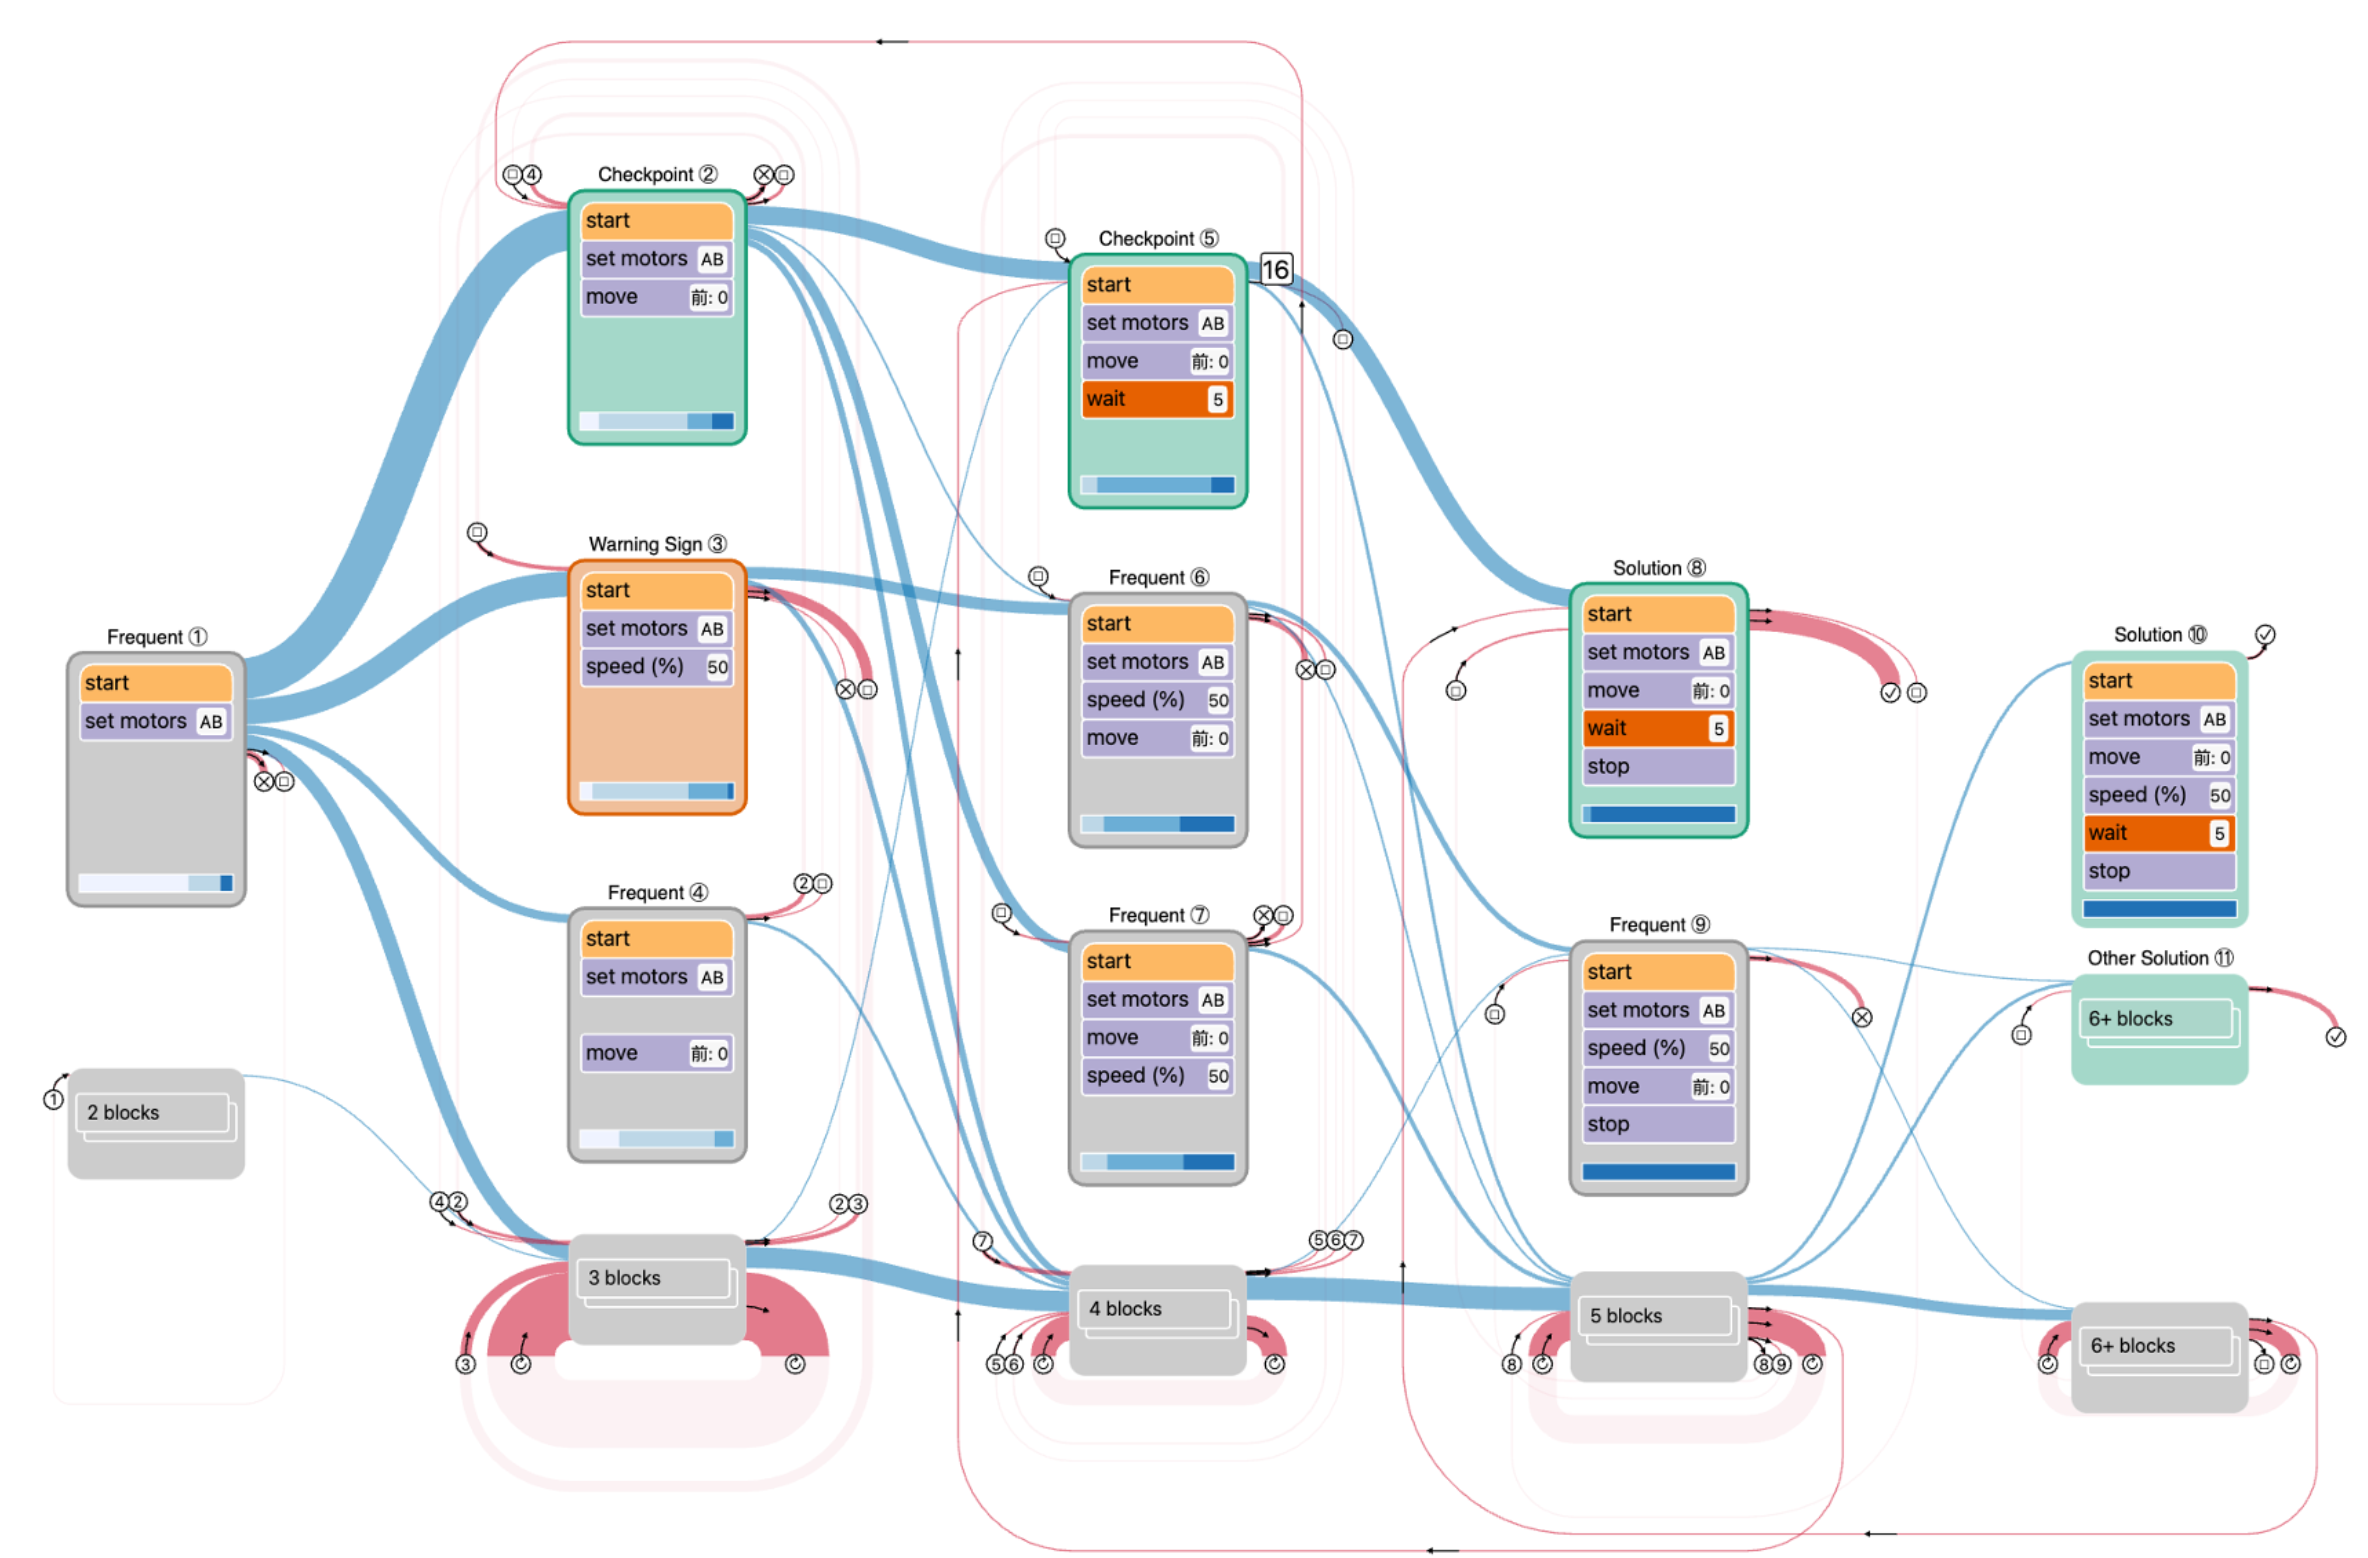
Online Learning
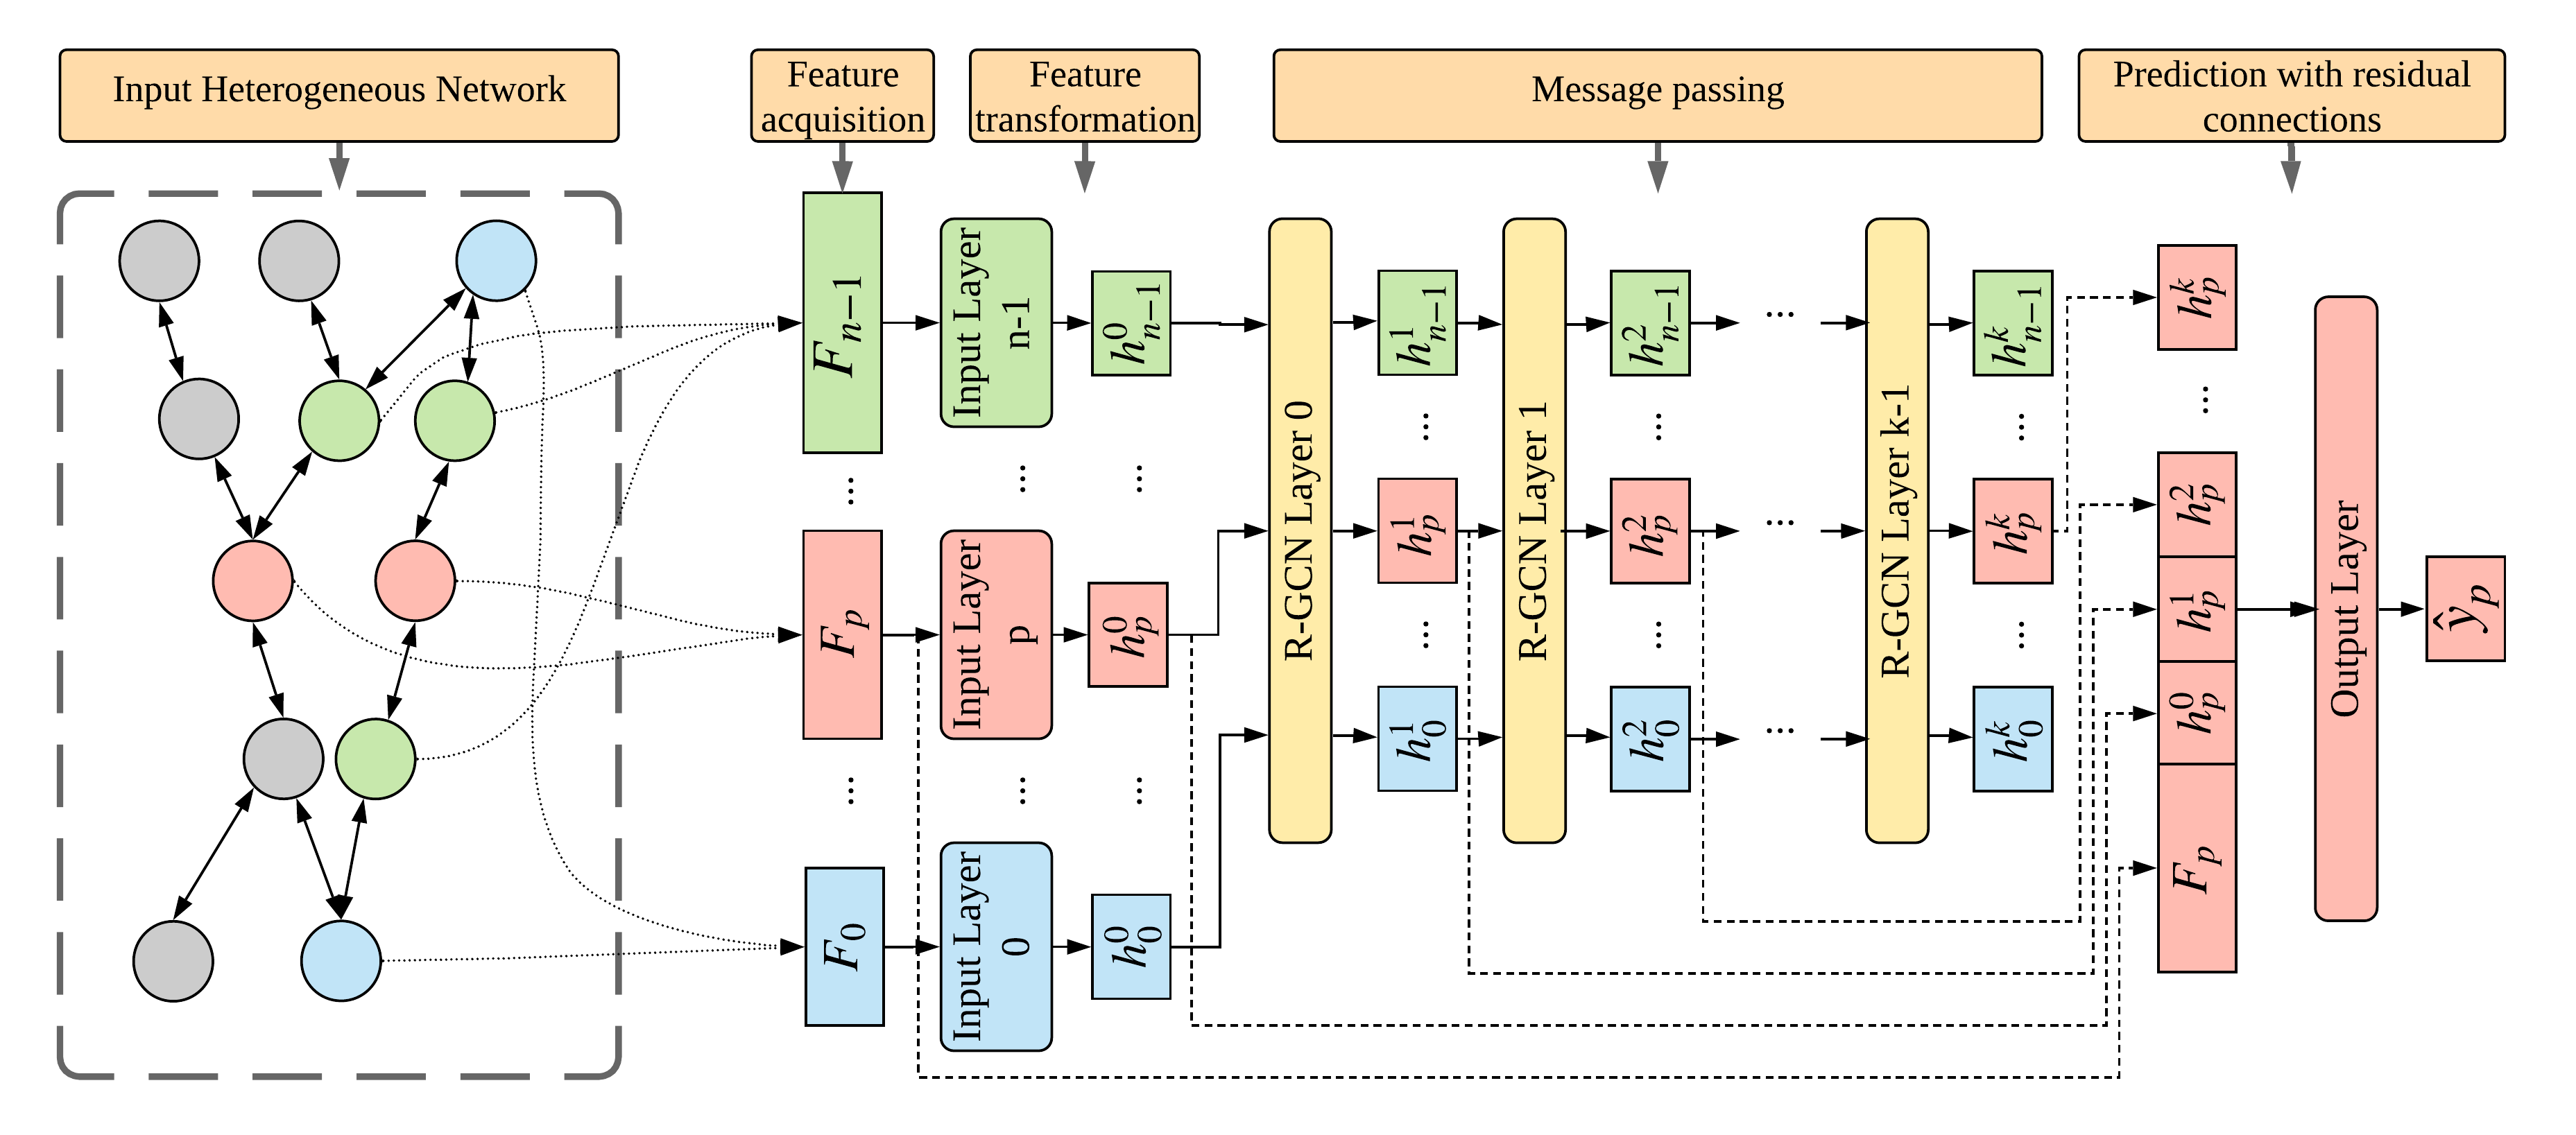
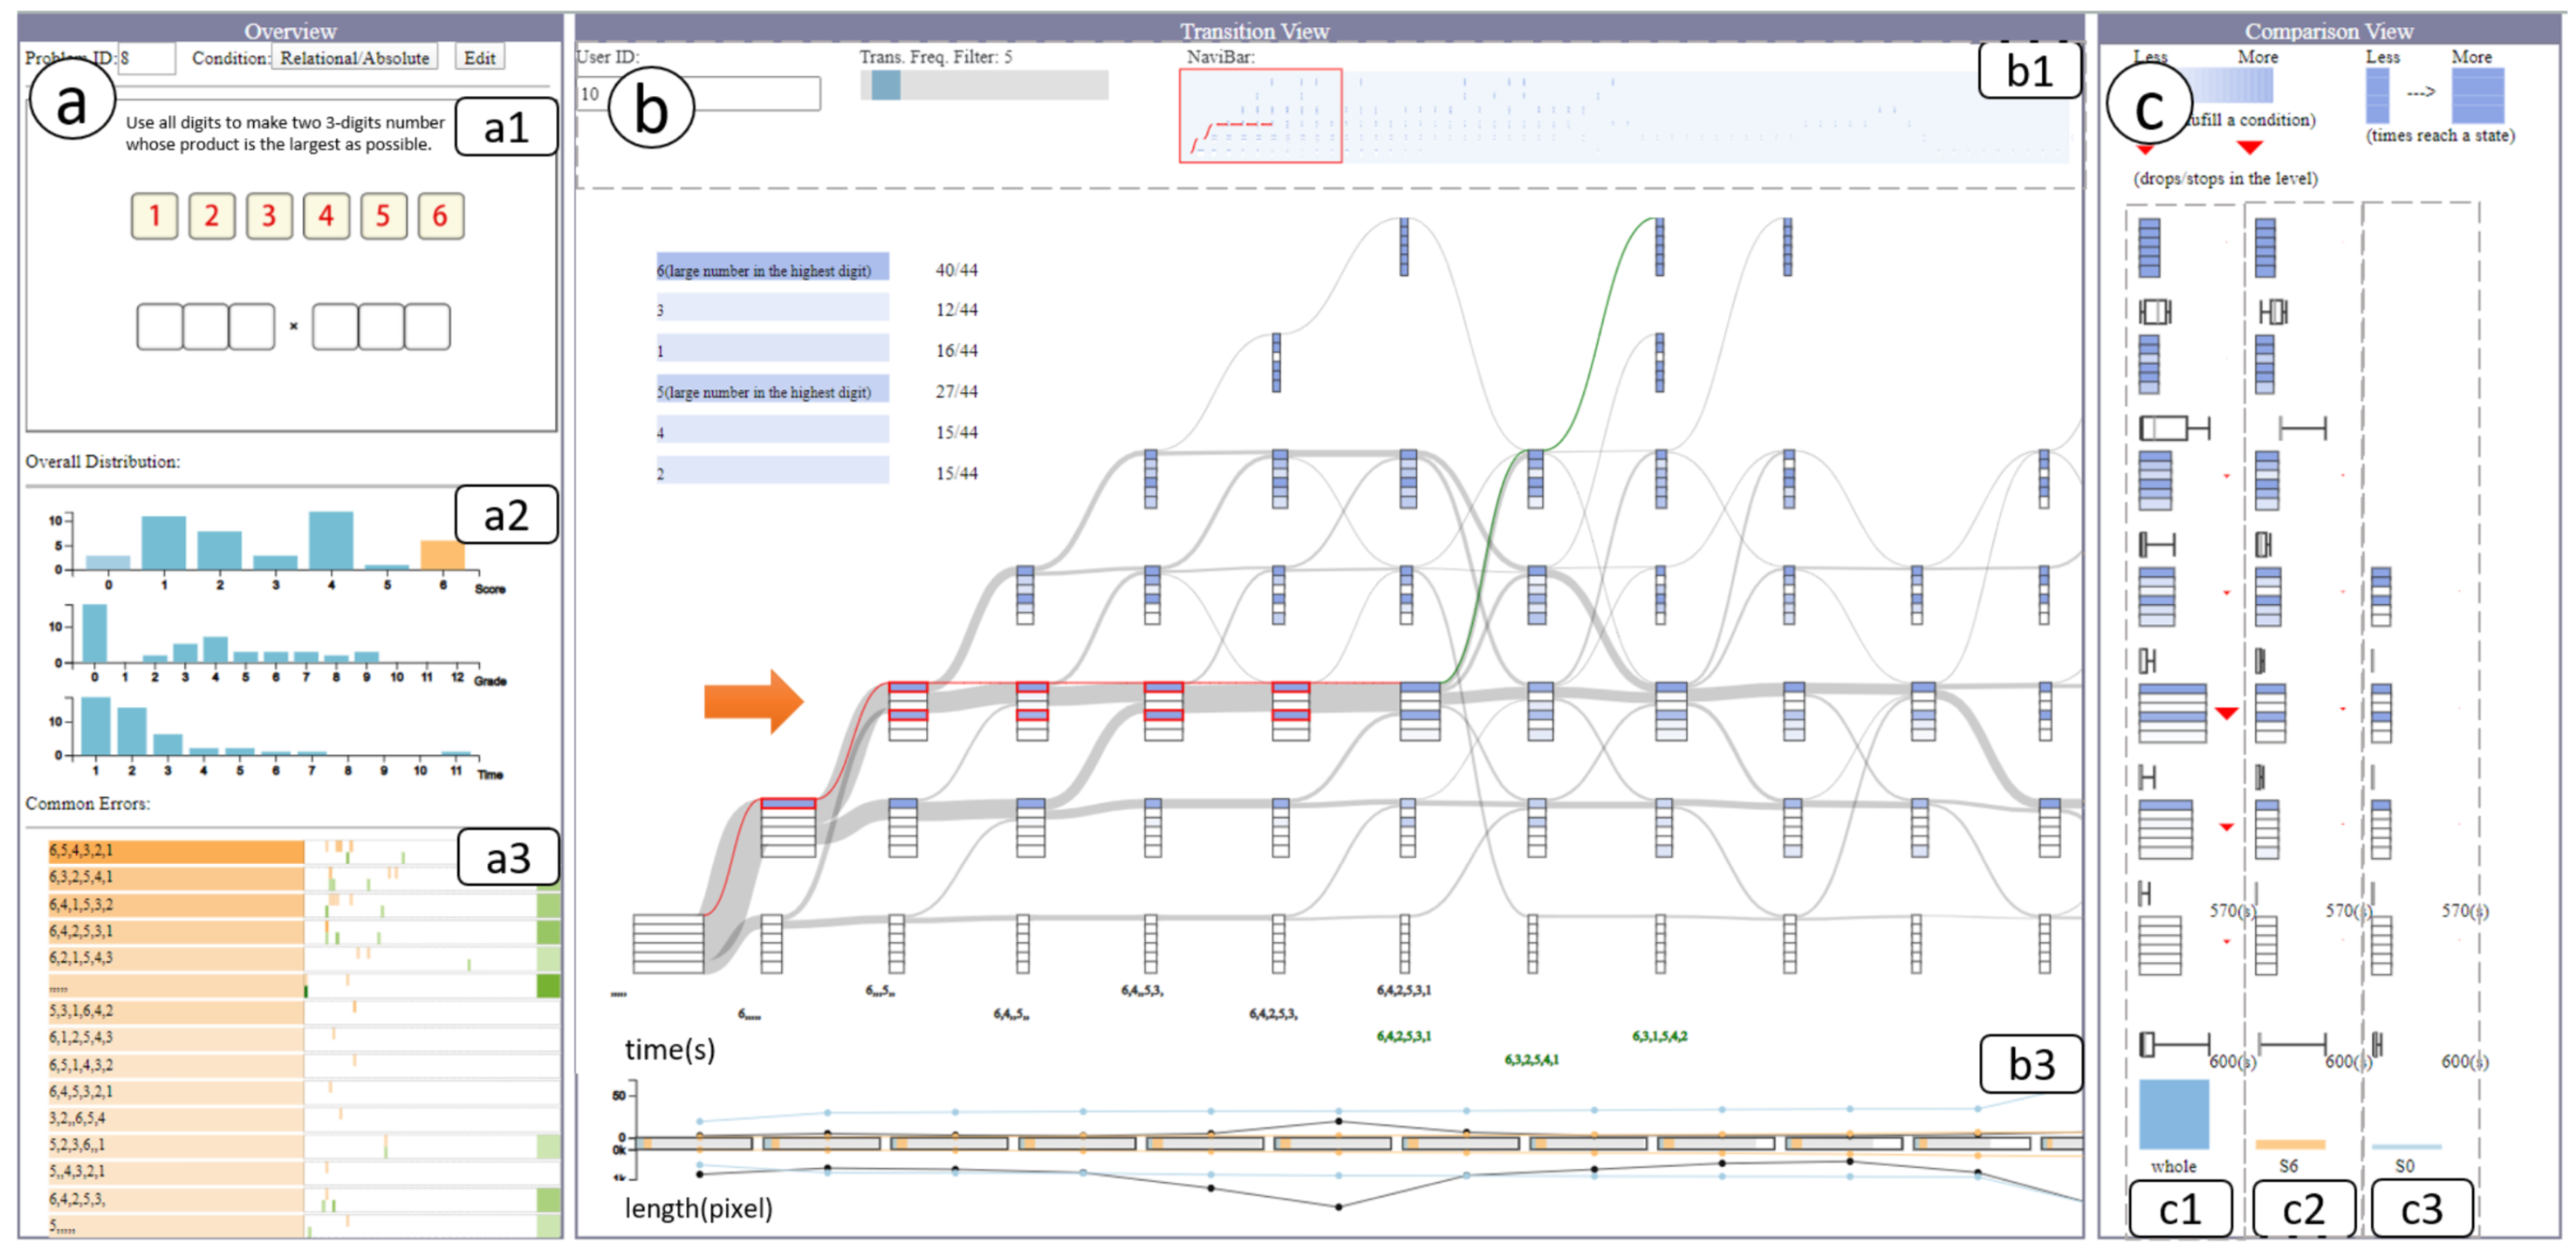
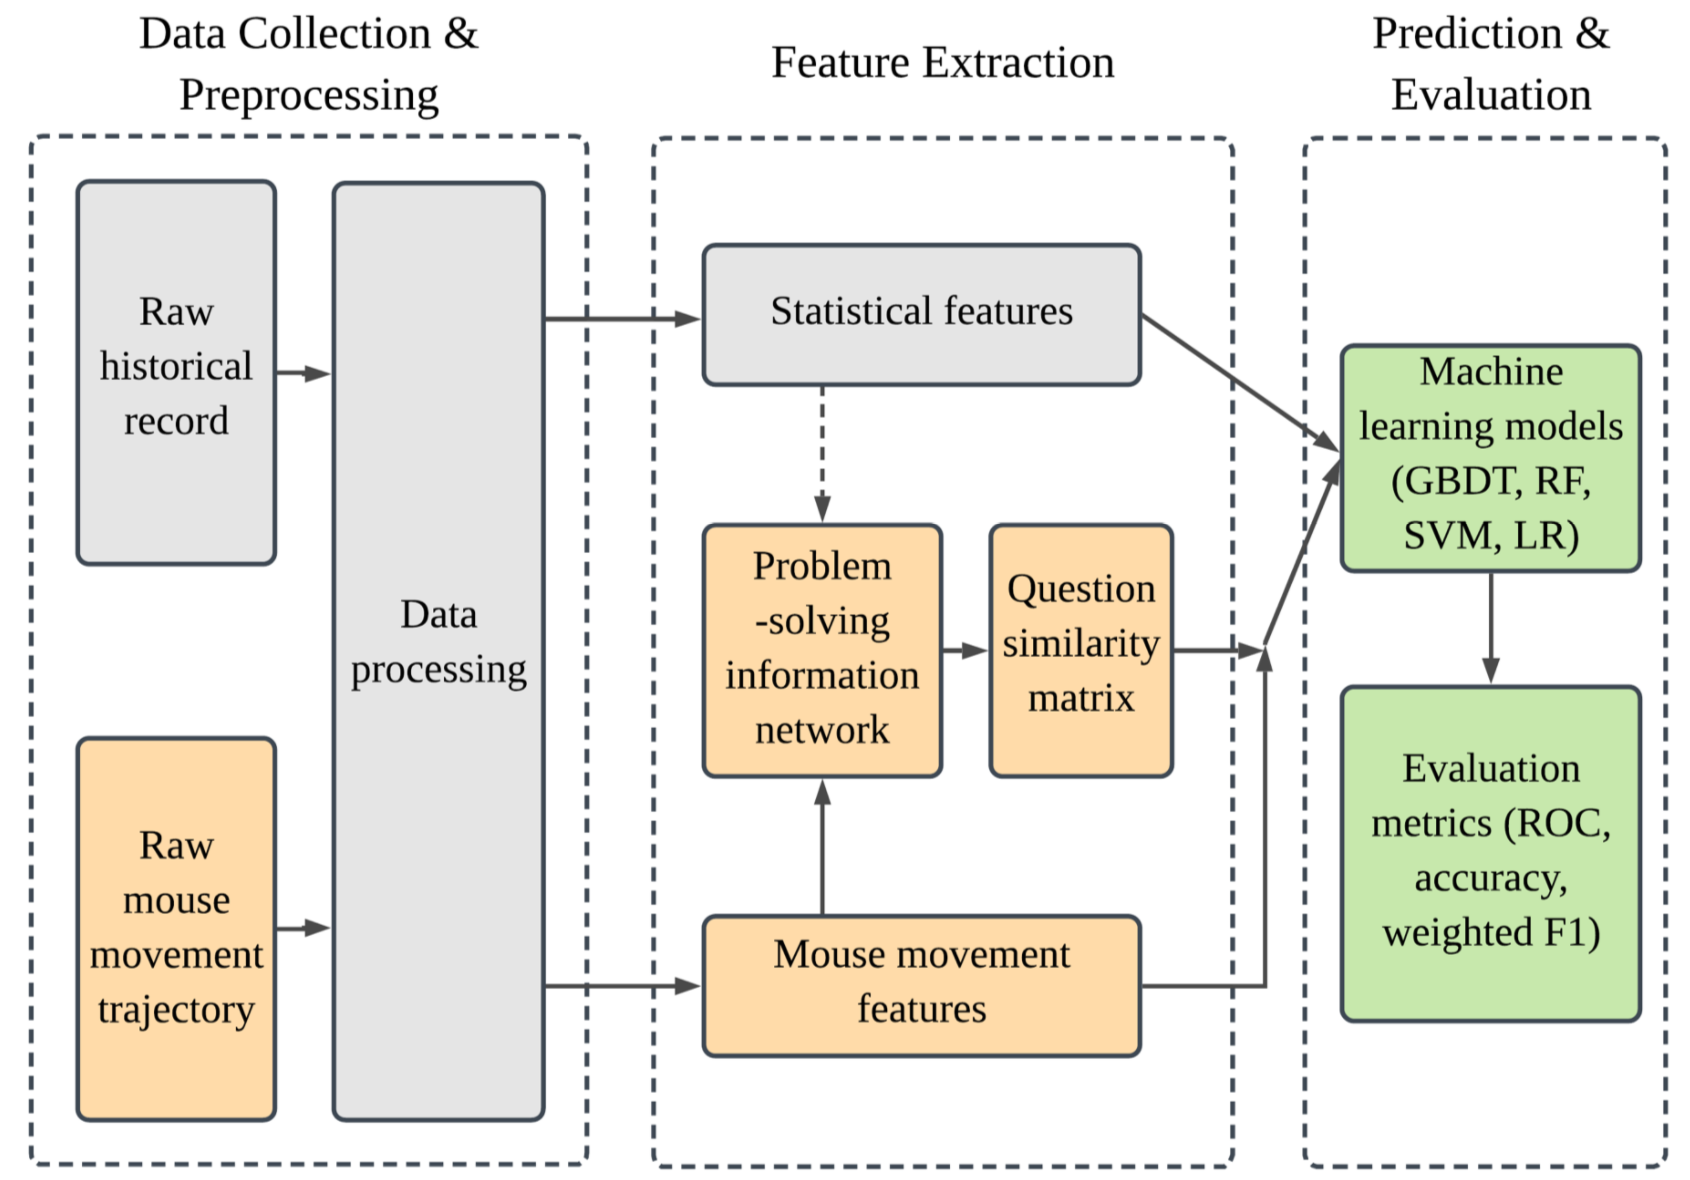
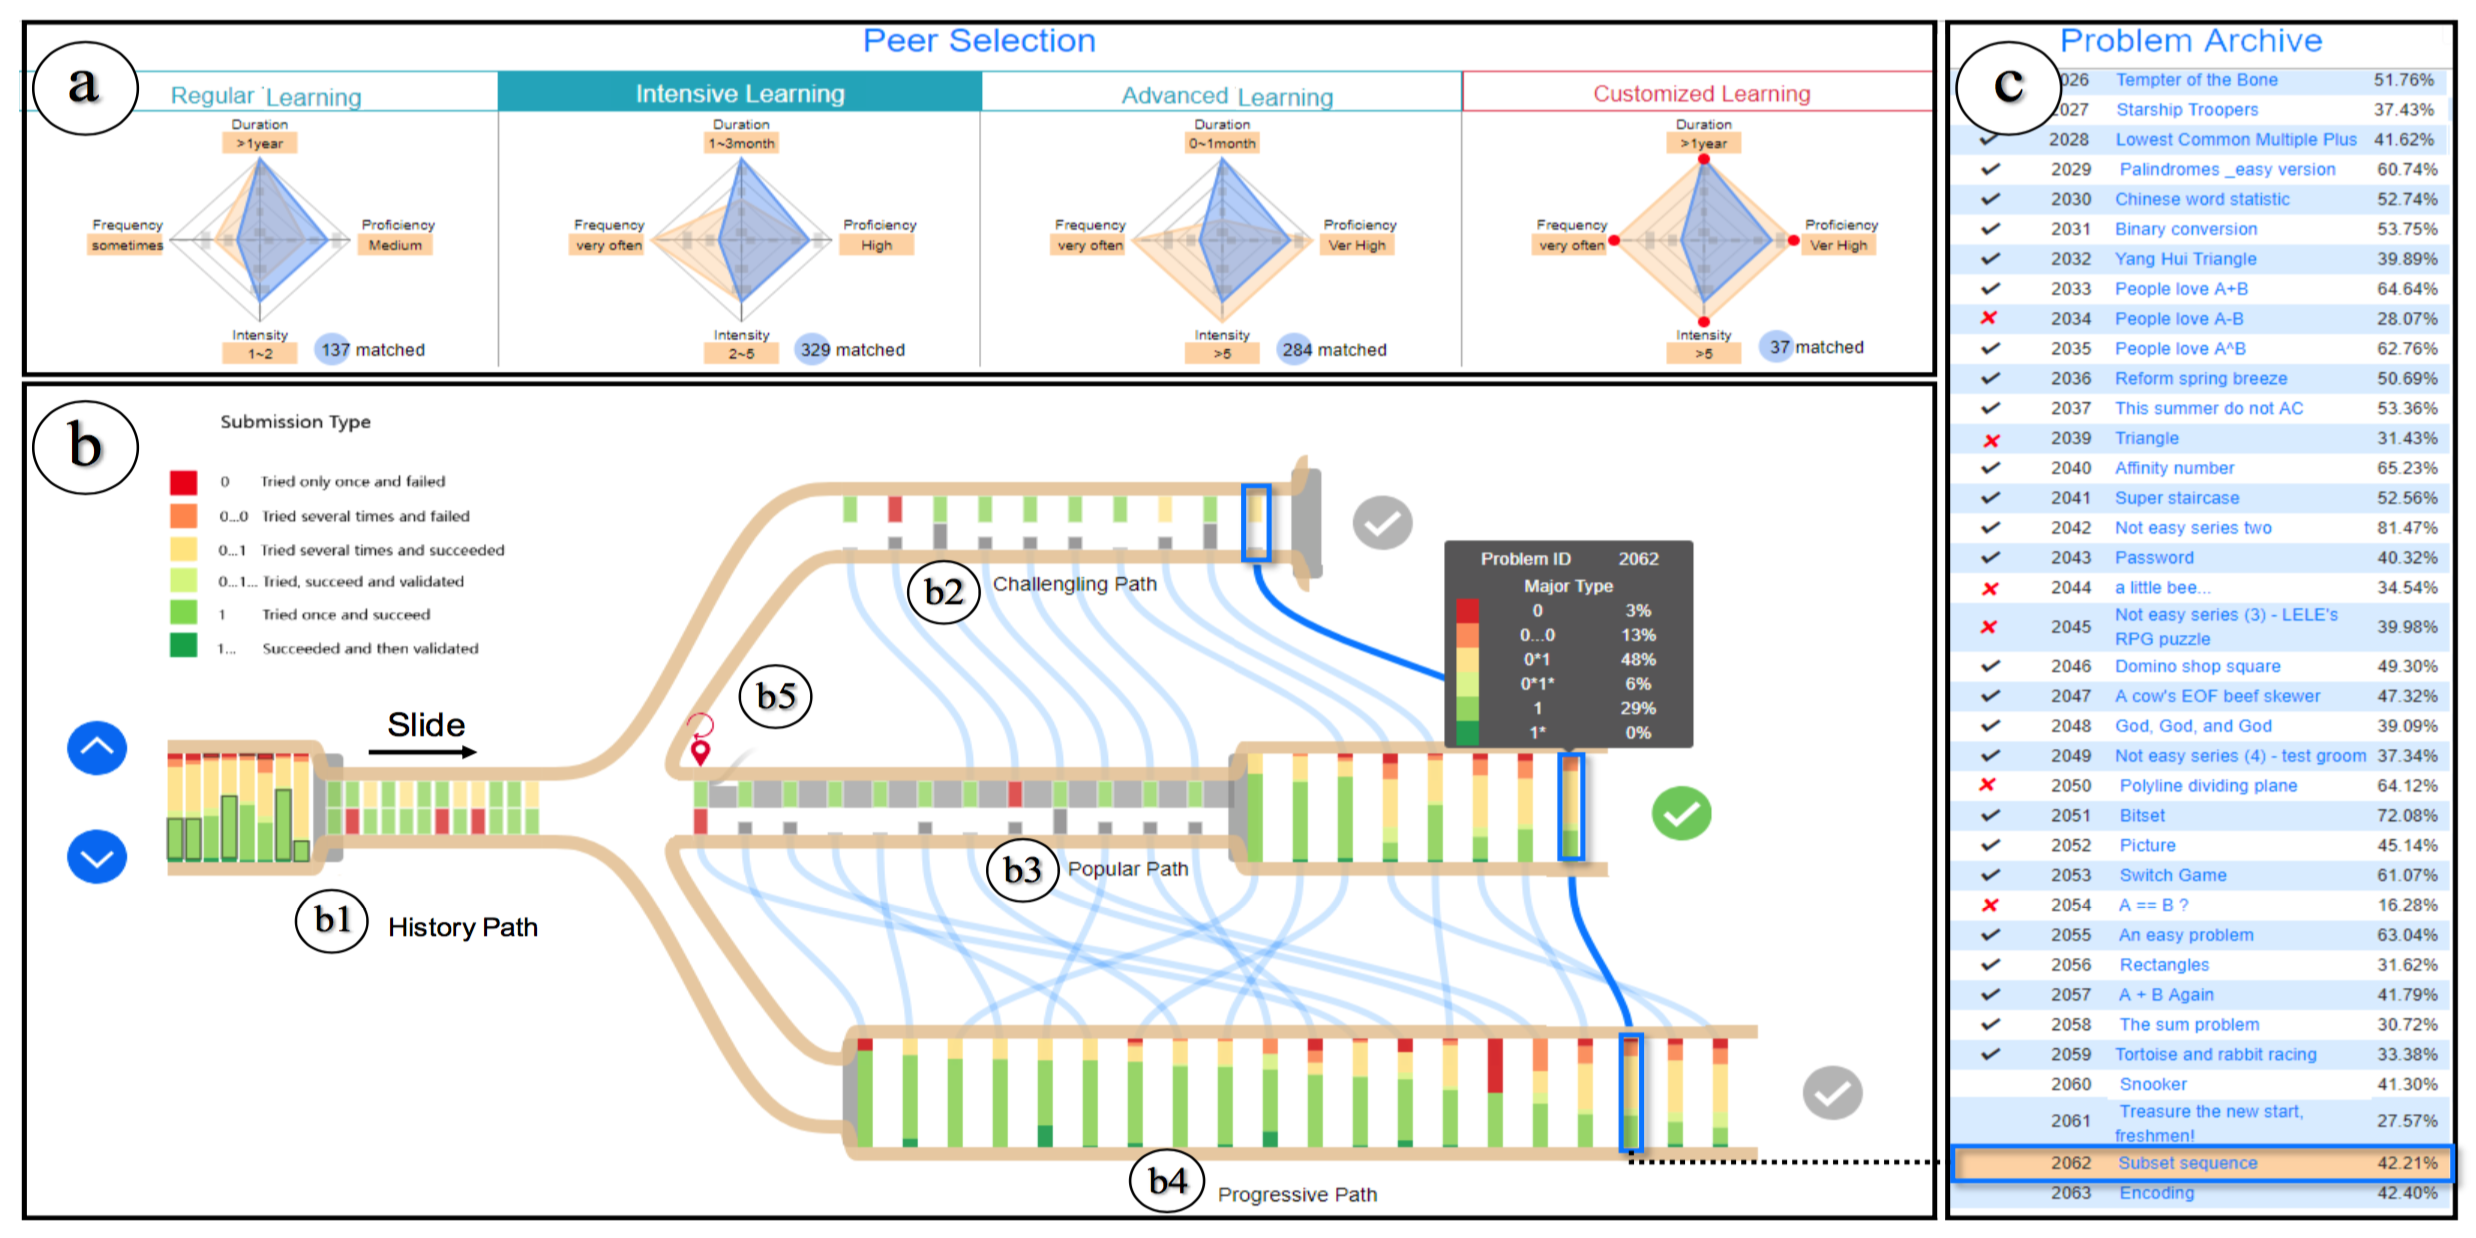
The past few years have witnessed the rapid growth of various online learning platforms, including Massive Open OnlineCourses (MOOCs) and online question pools. The large volume of online-learning related data (e.g., clickstreams, video view-ing histories, learner profiles, and grades) collected by the platforms provide a golden opportunity to understand the students’learning behaviors. We have proposed novel both deep learning and visual analytics techniques help different stakeholders analyze these data. For example, we have proposed a novel graph neural network approach to predict student performance on individual questions. We have developed interactive visual analytics systems to help students conduct interactive learning path planning or assist question designers in gaining a deep understanding of student problem-solving behaviors in online question pools.
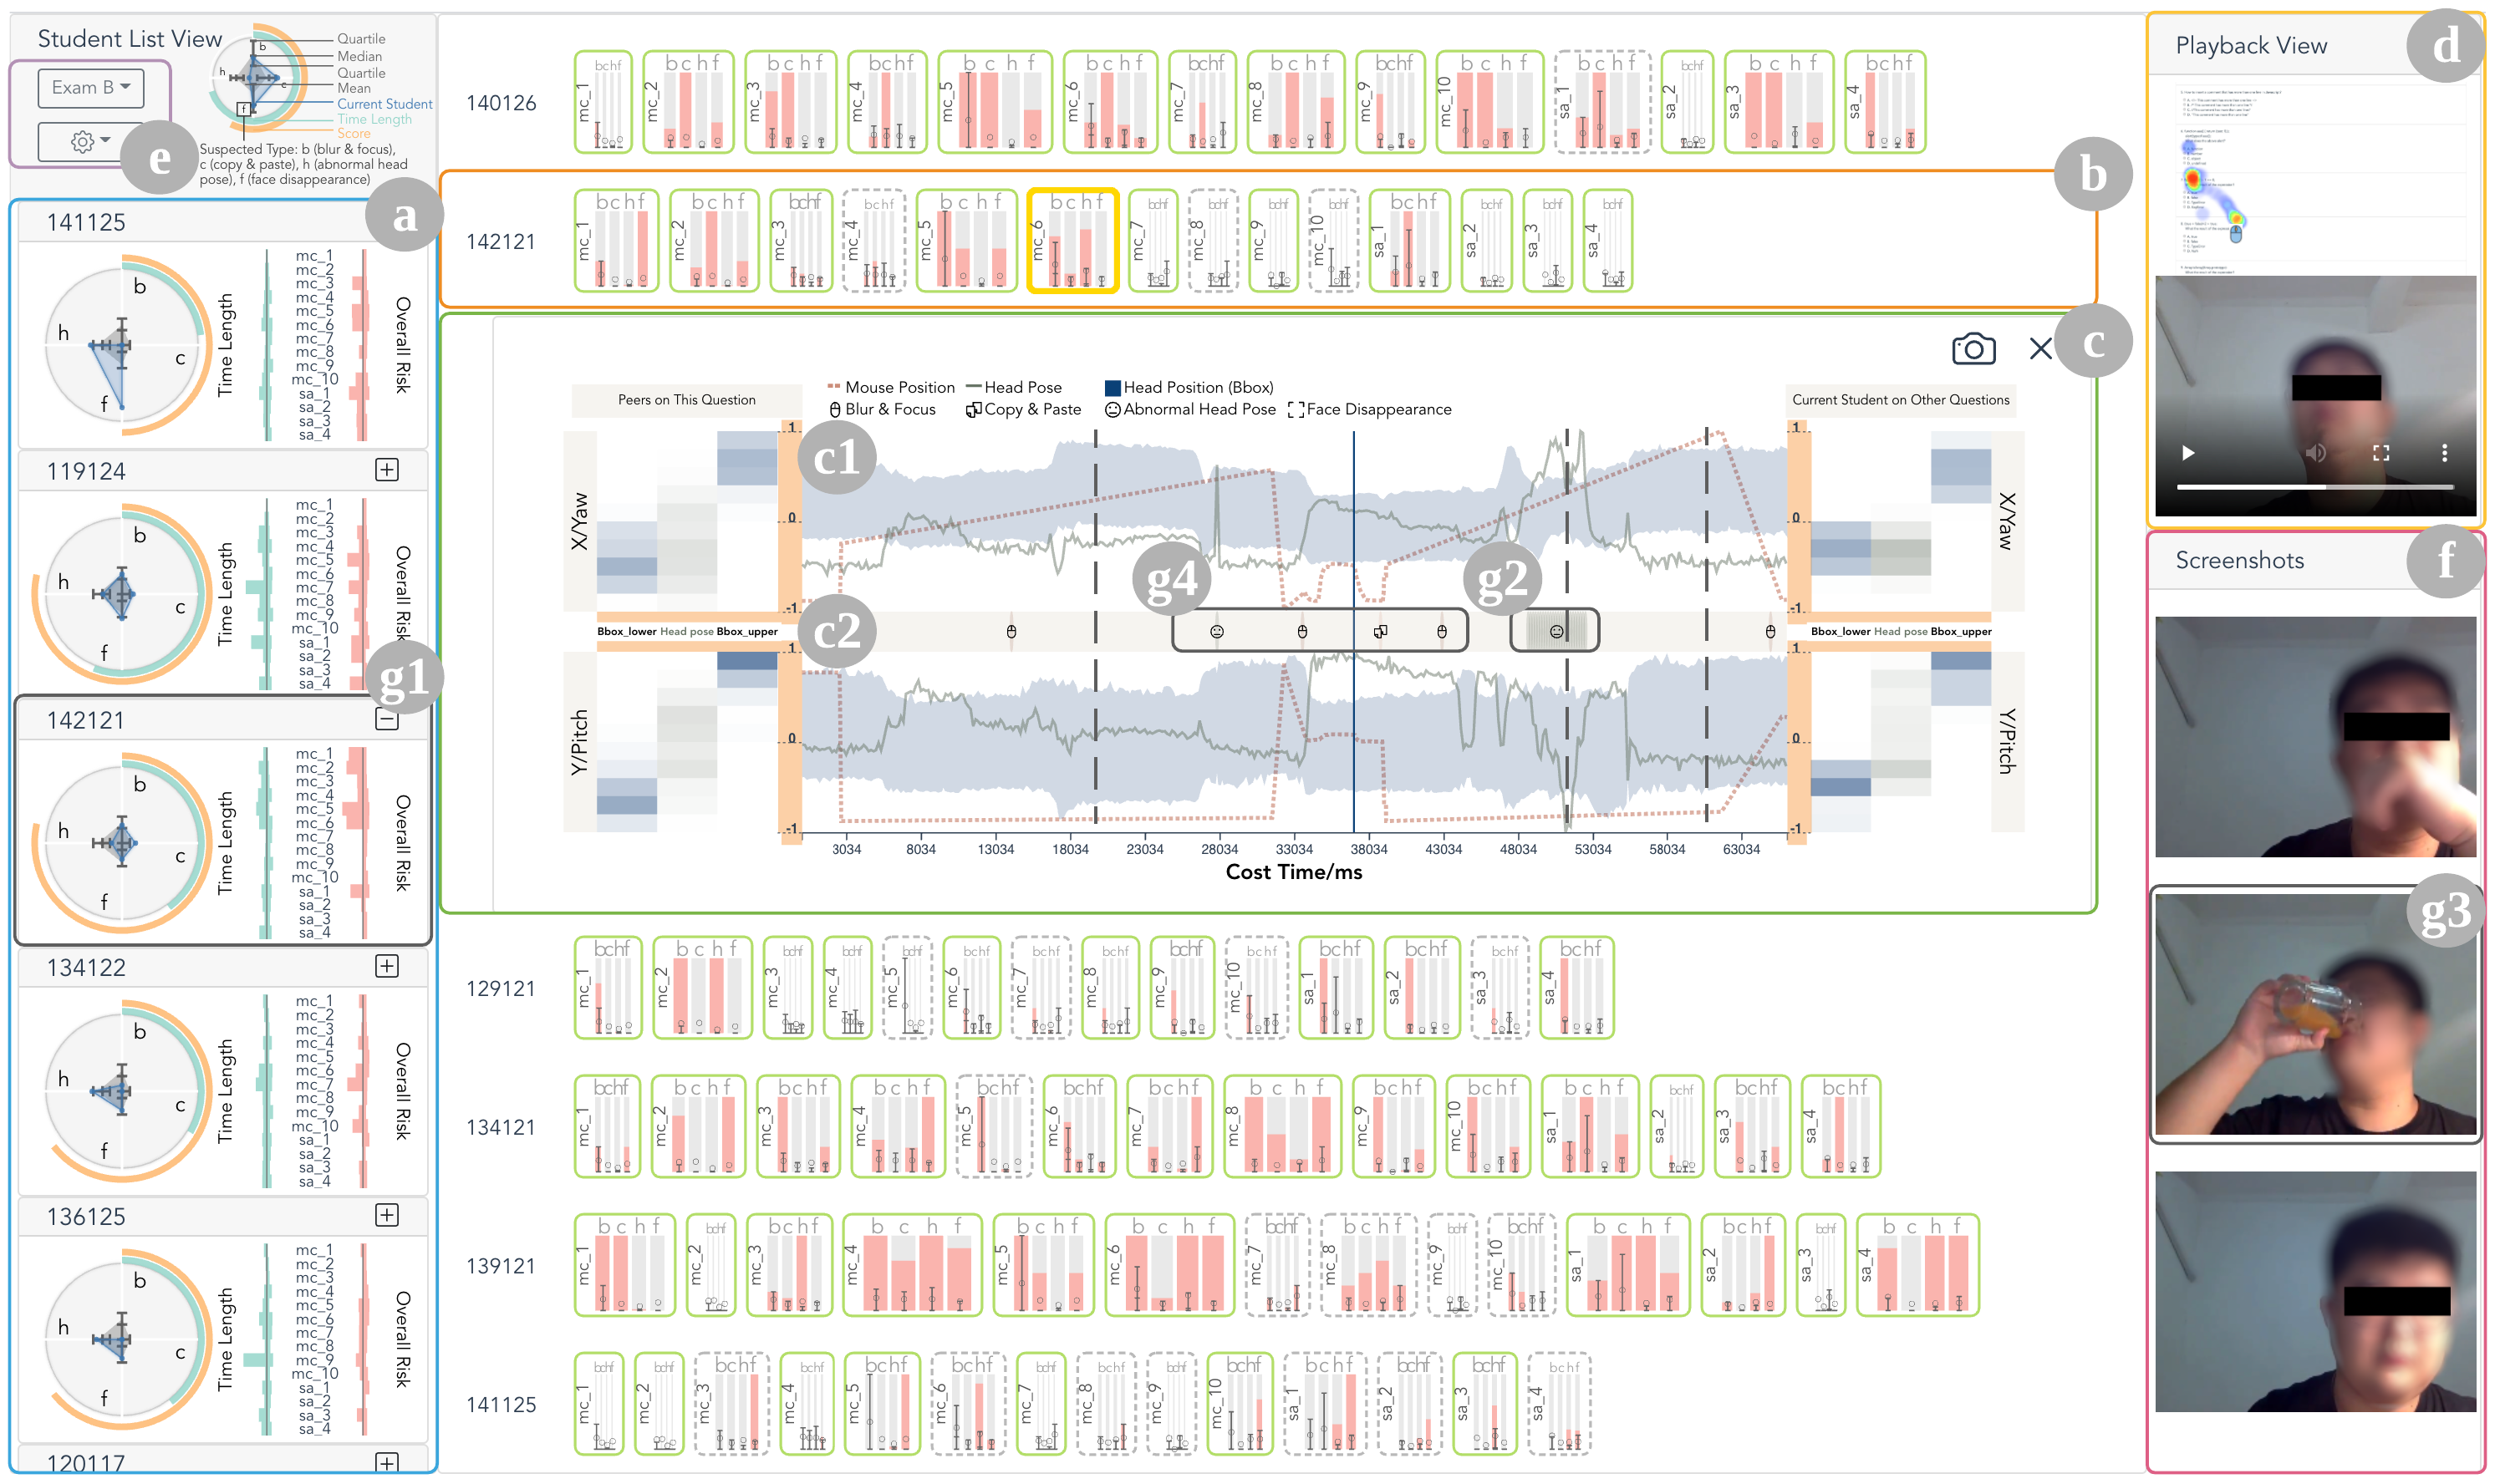
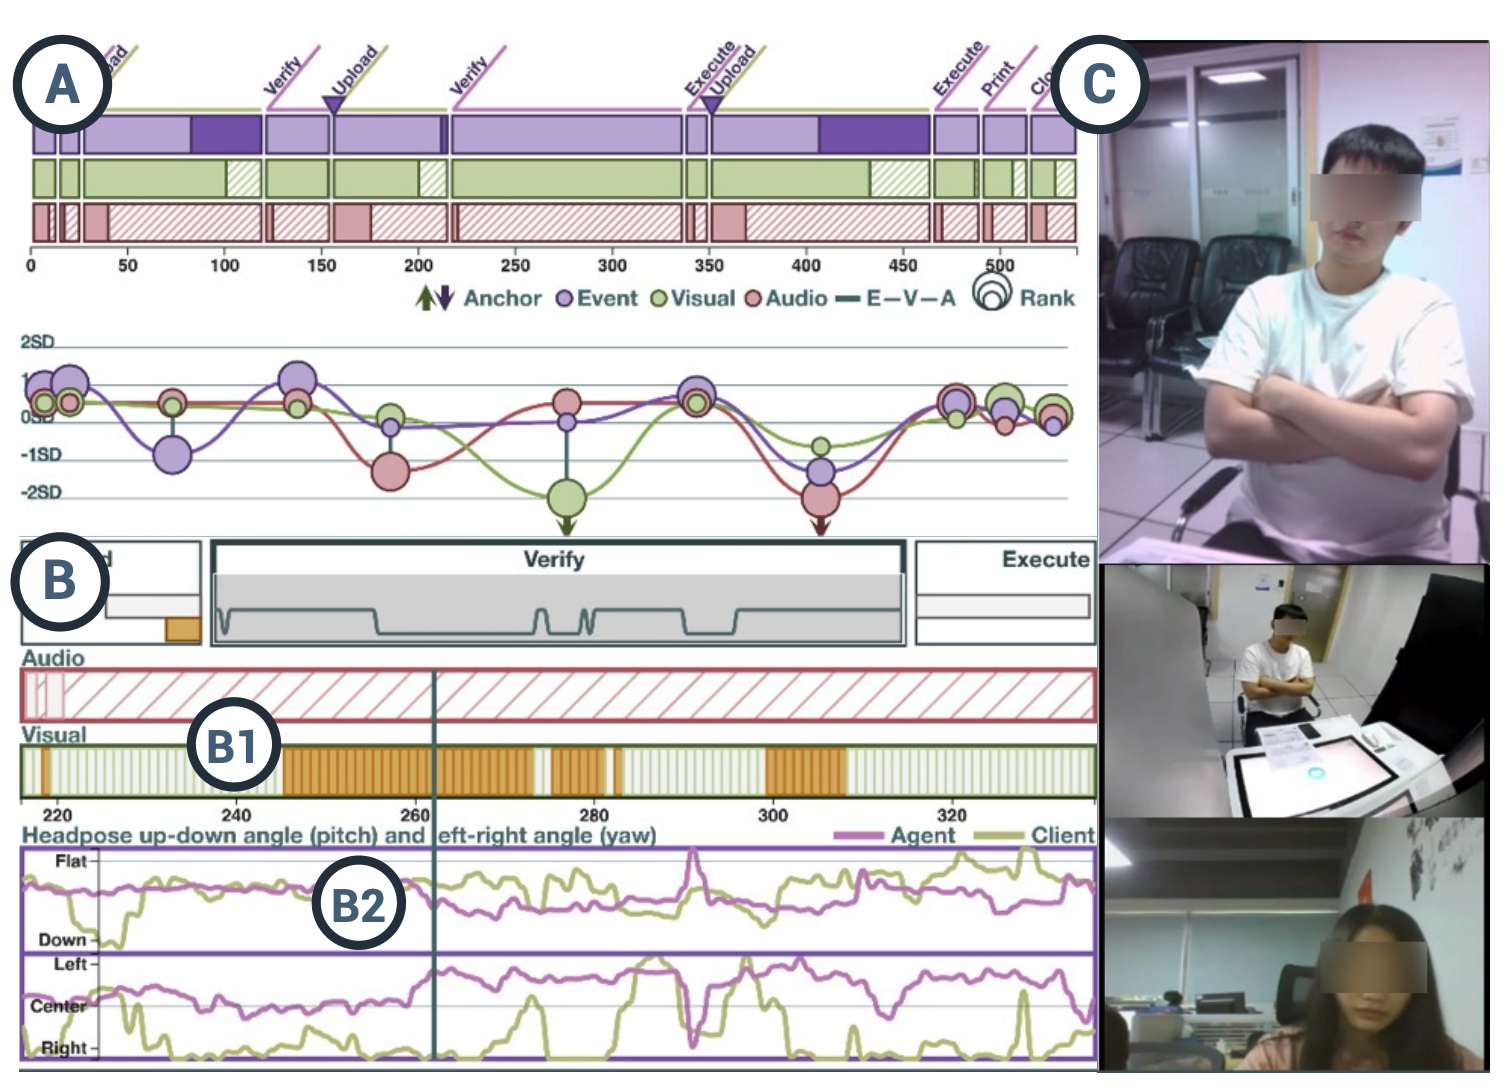
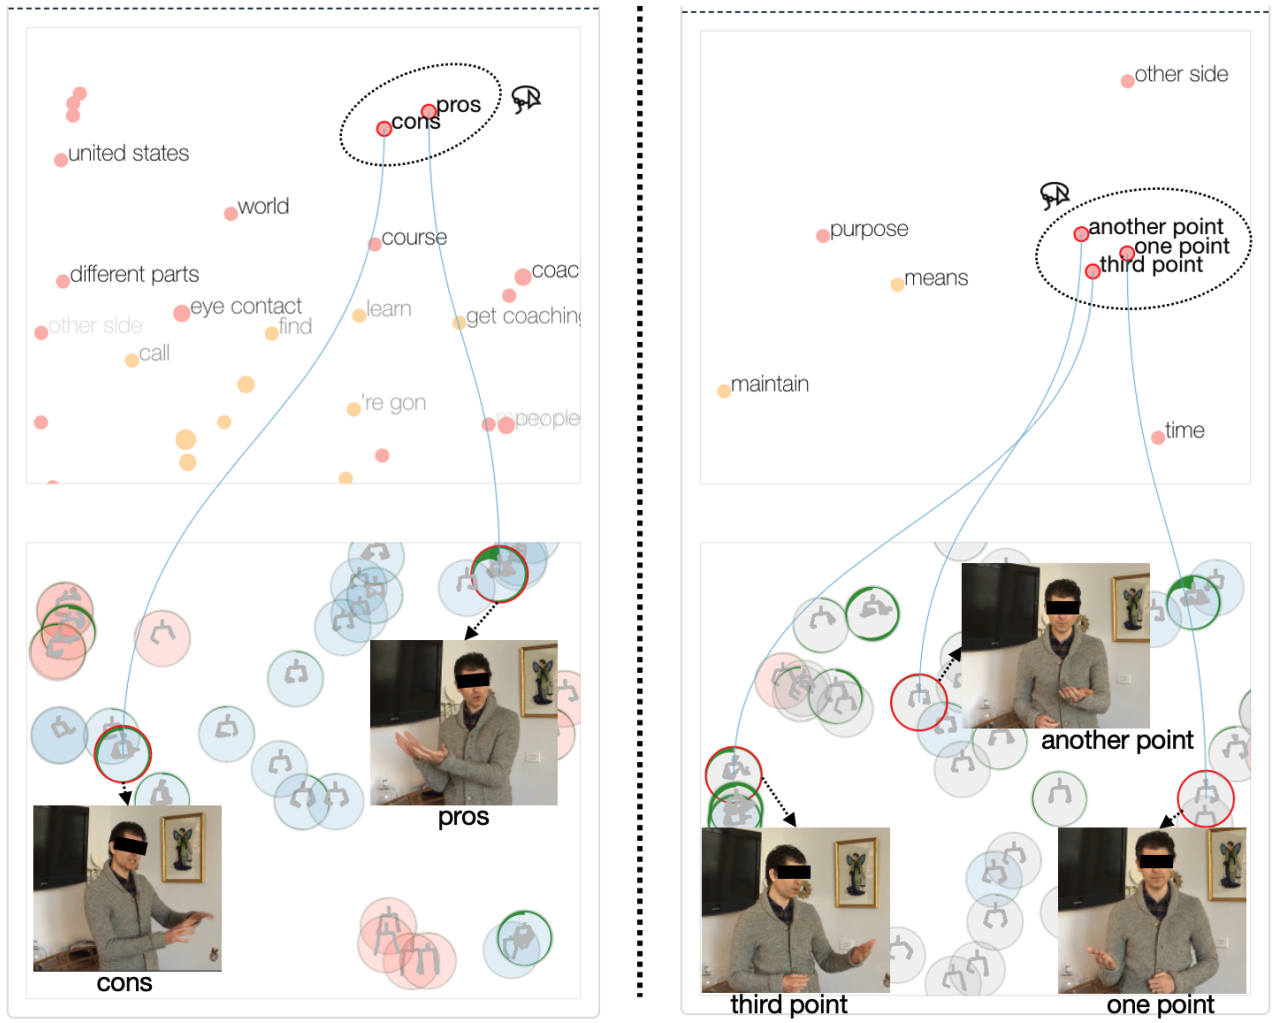
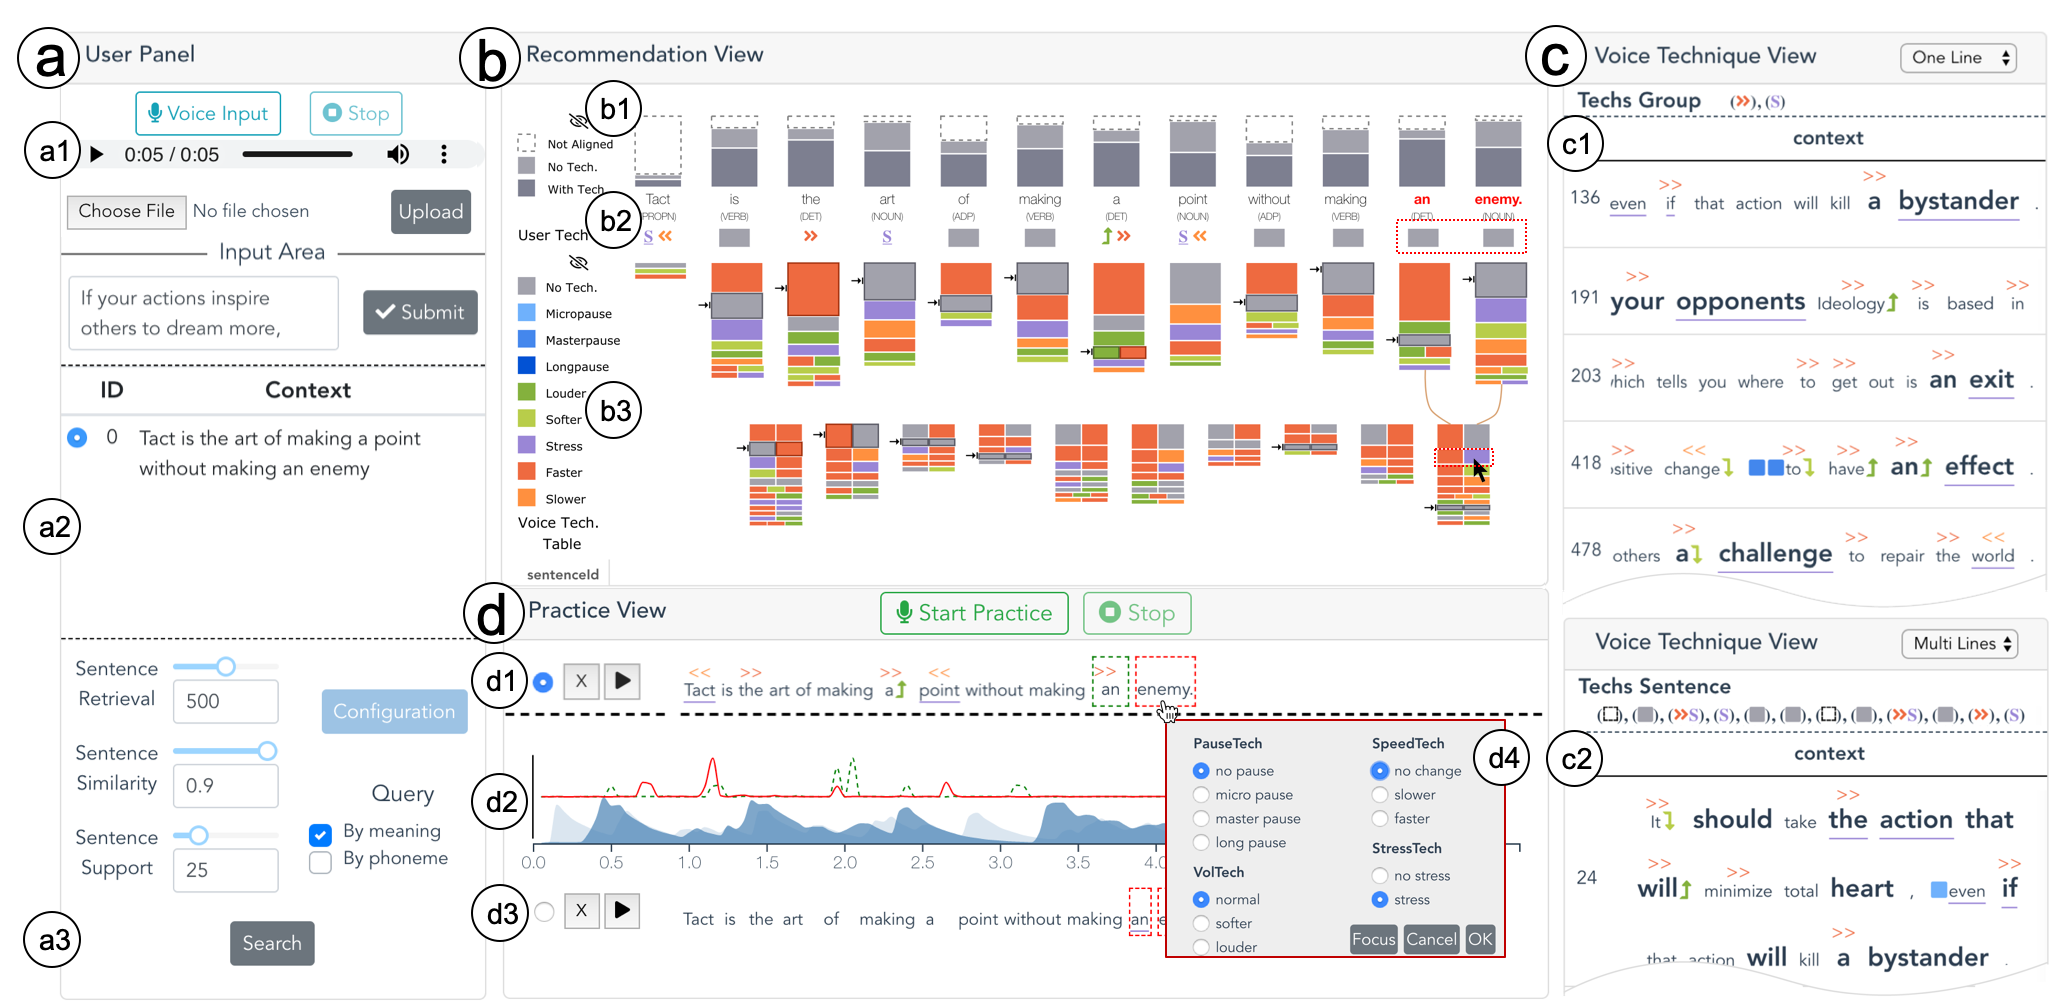
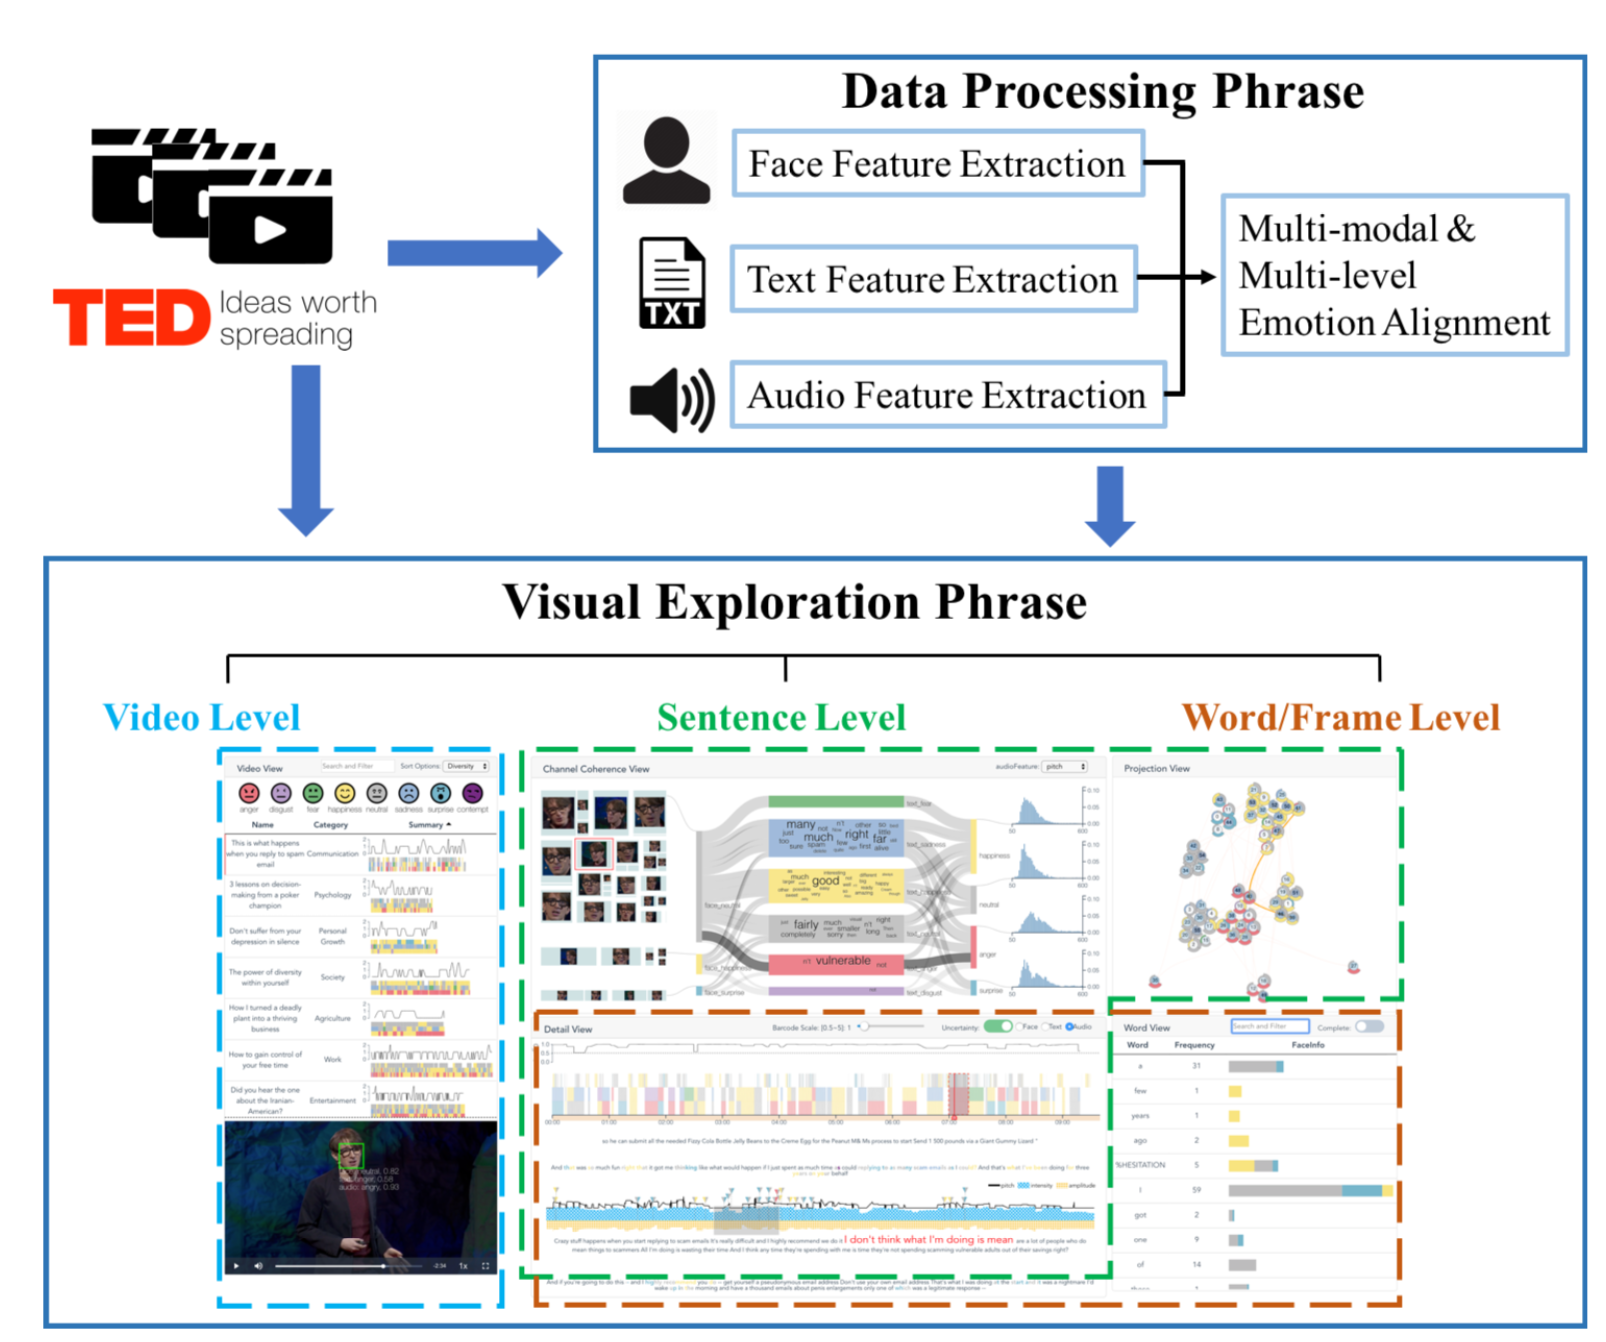
Video-driven Presentation Training
Public speaking is one of the most important interpersonal skills and can help people achieve all the objectives of business and personal communication. There are plenty of reasons to master public speaking. For example, it can increase self-confidence, generate better business sales or help one get a better job. With the advancement of information technology, more and more public speaking videos are recorded and can be accessed online (e.g., TED talks and other online presentations). We worked closely with an international public speaking training company to investigate how we can make use the video data faciliate presentation training.
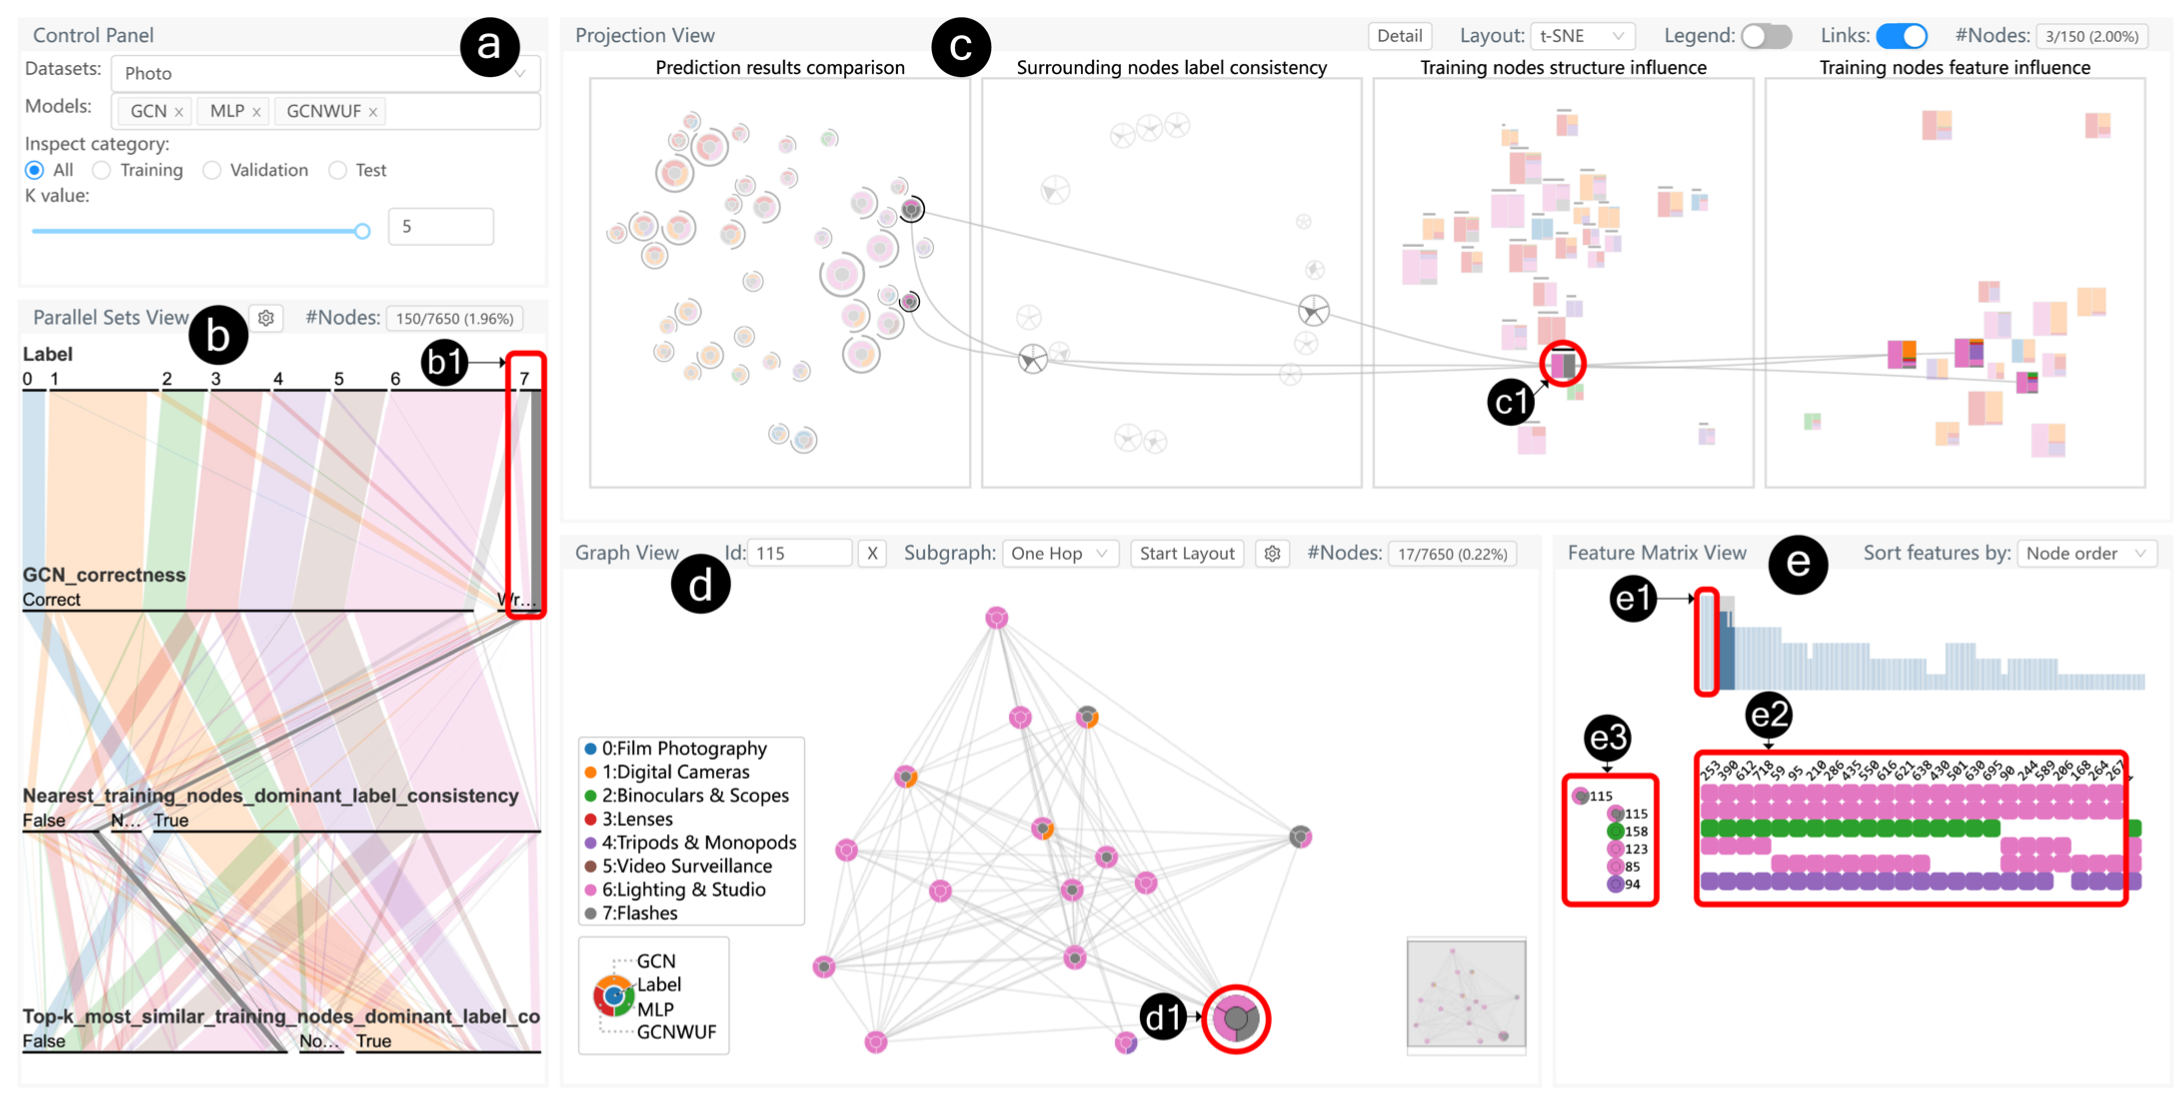
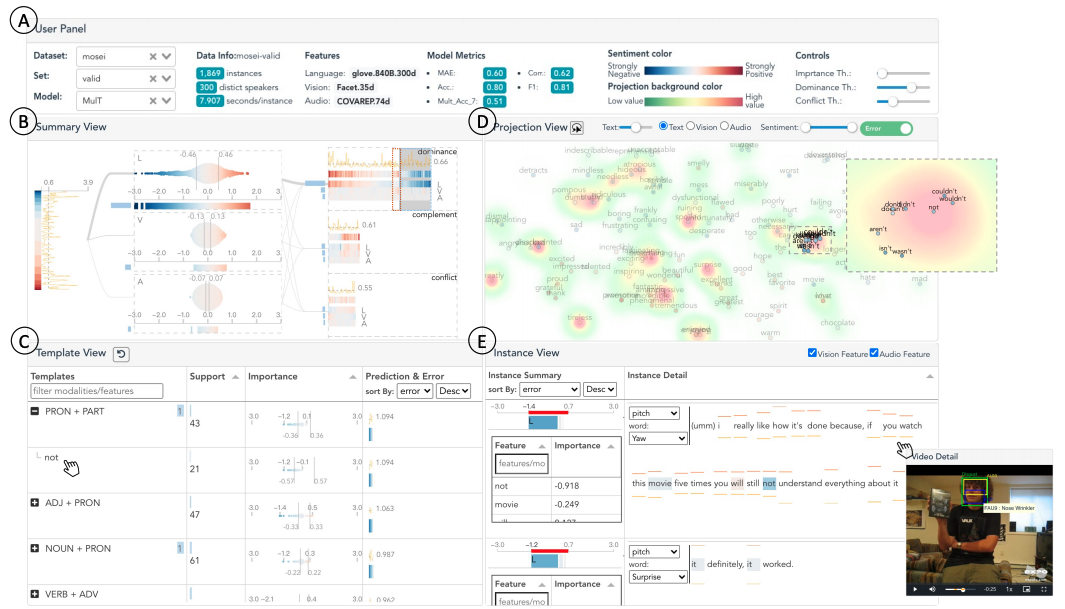
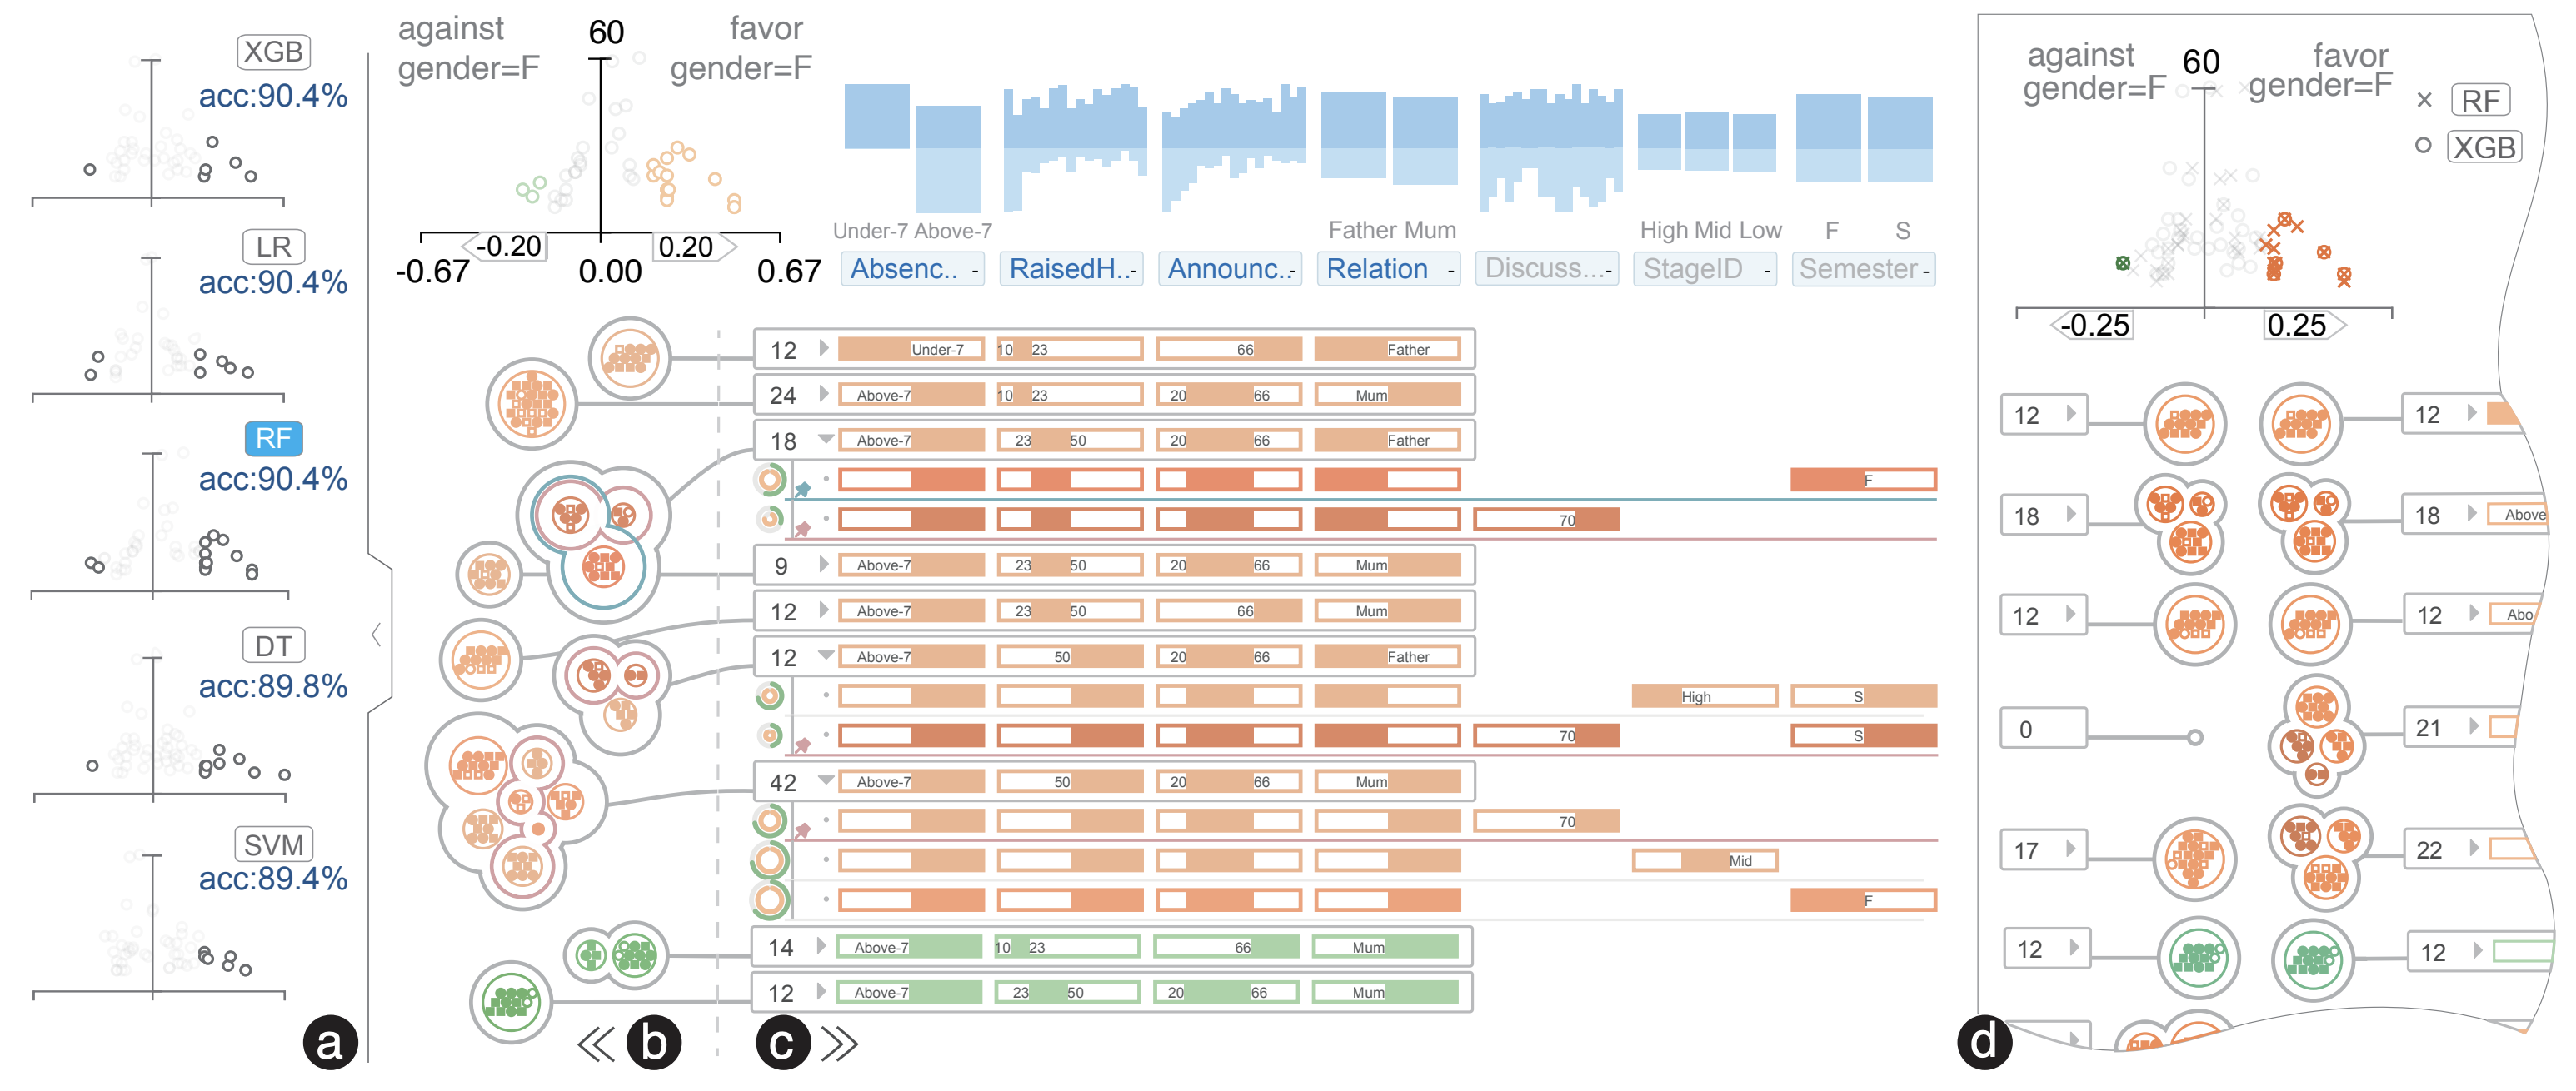
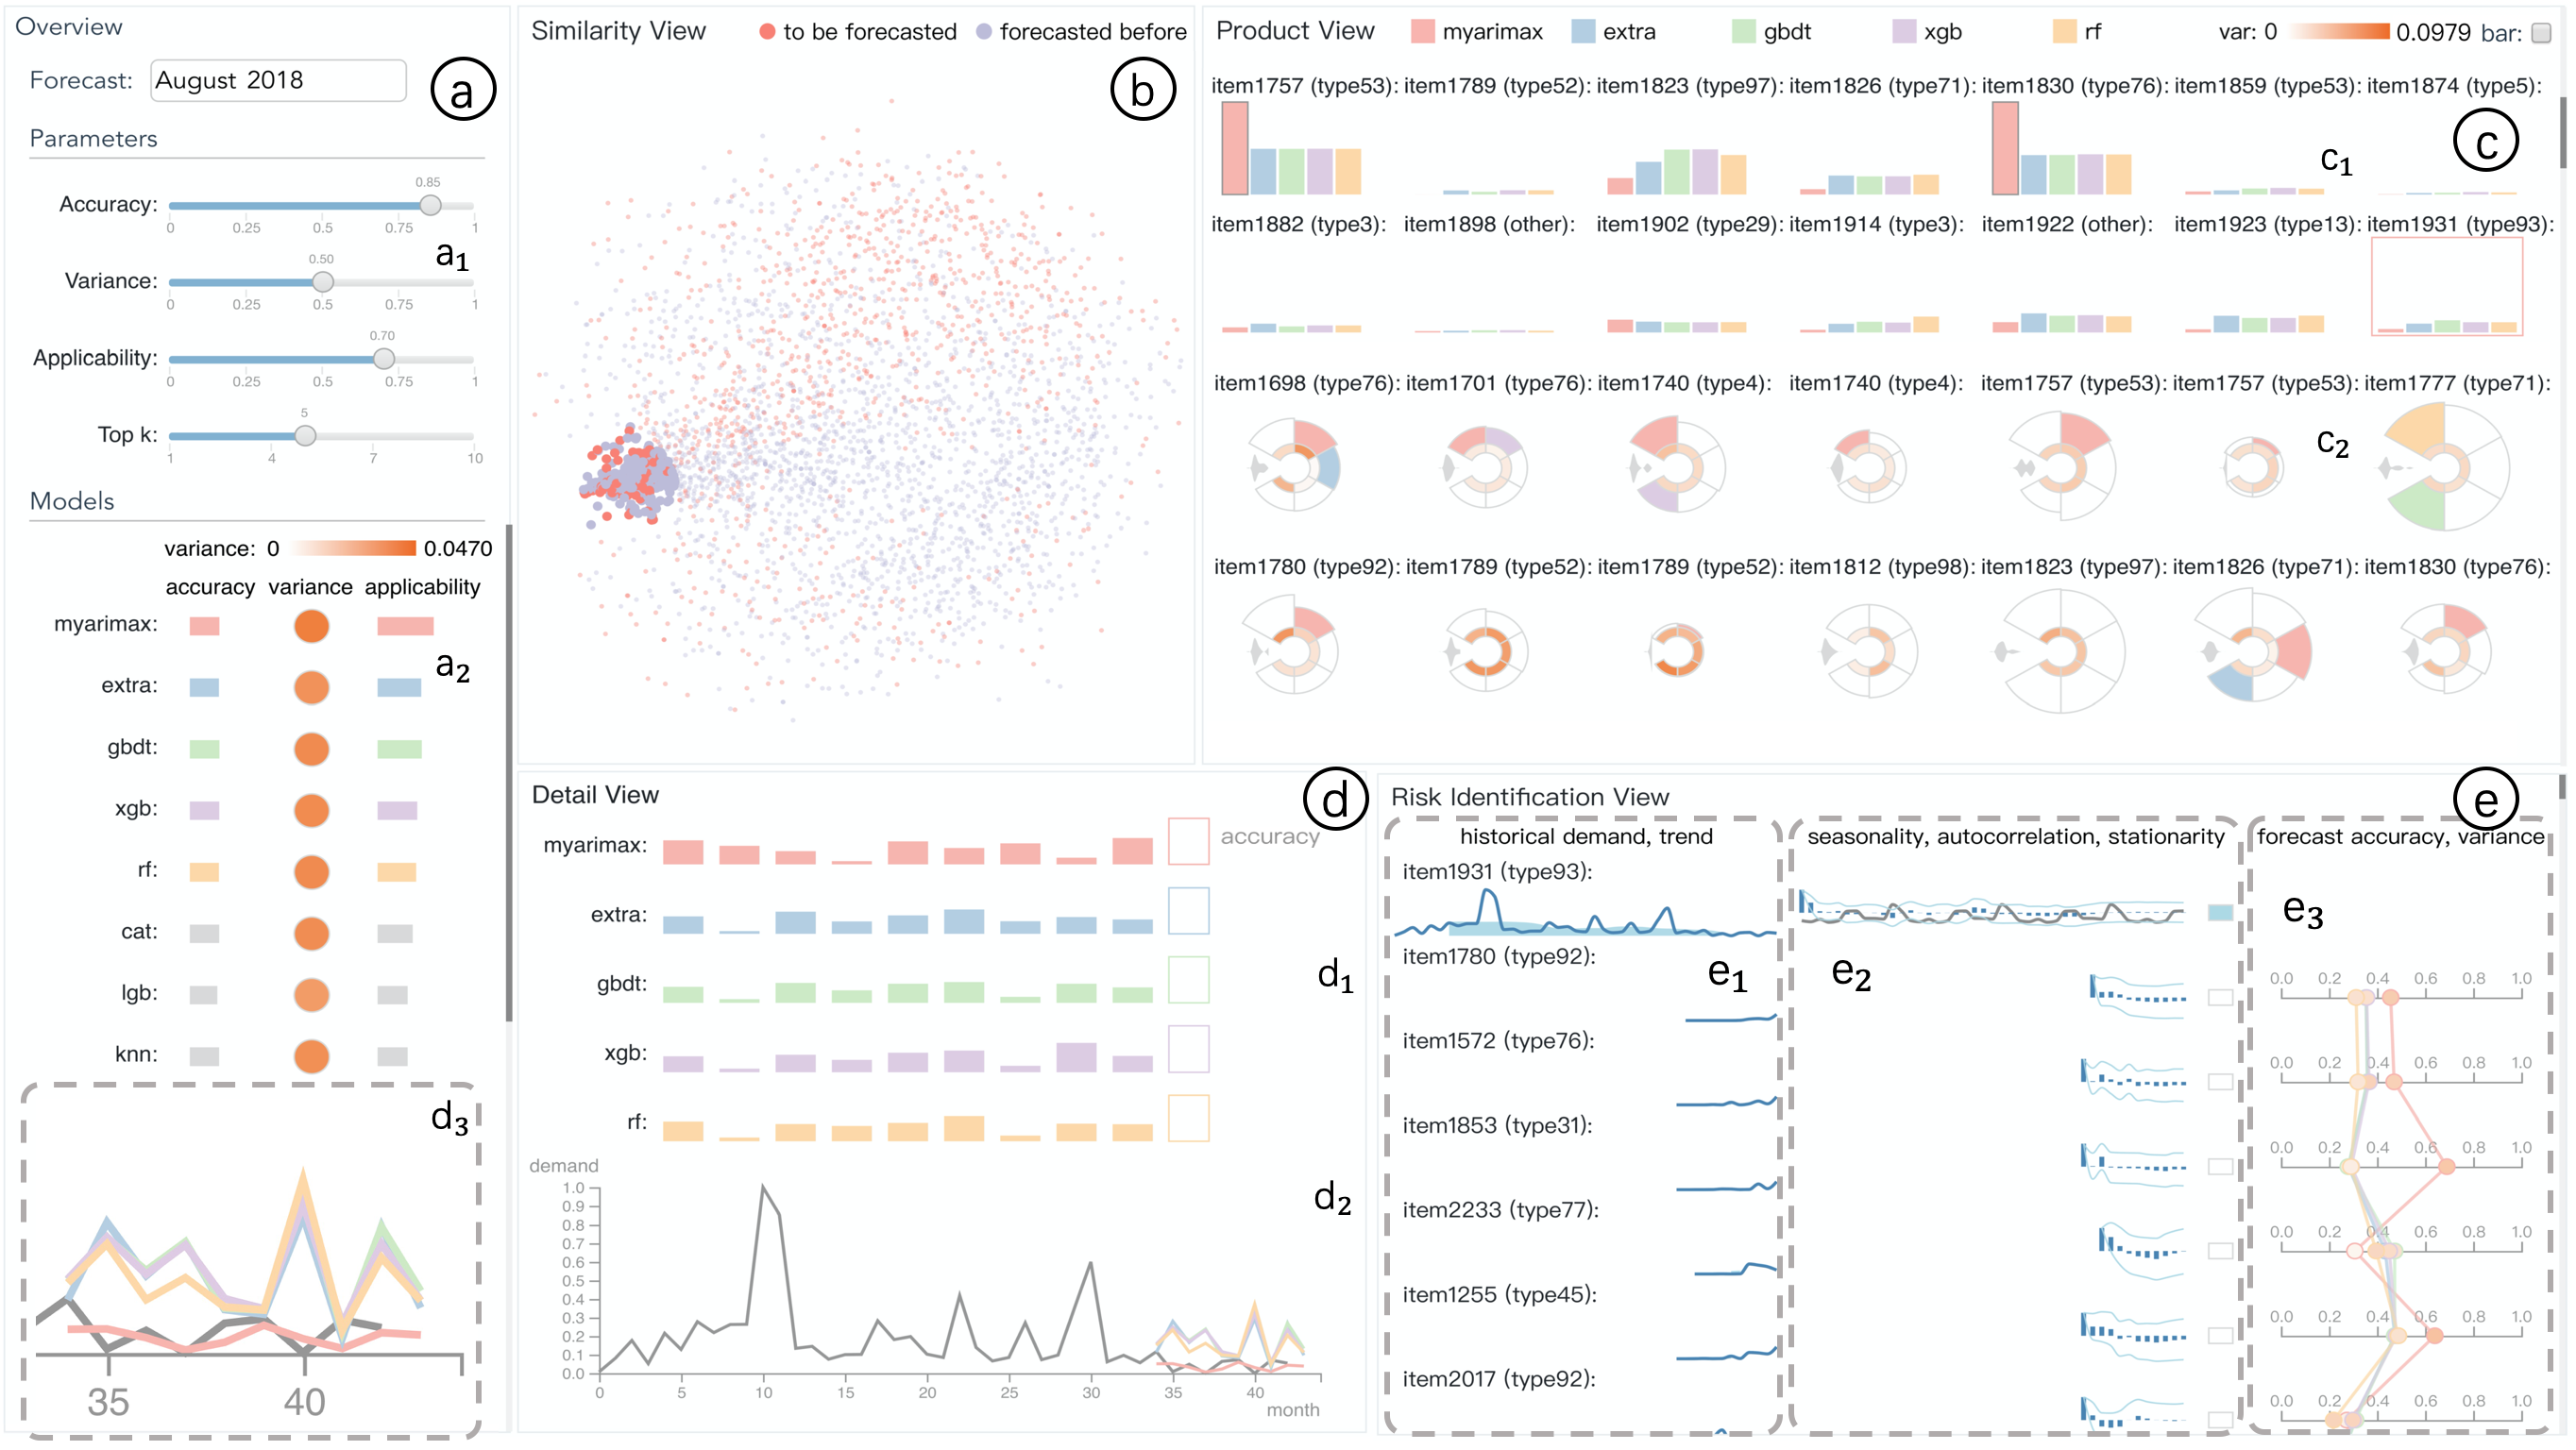
Explainable AI
Artificial intelligence (AI) techniques have been extensively explored and widely applied in various domains in the past decades. With the increase of model complexity, it is often challenging for model users as well as model developers to understand and explain the underlying model mechanism. However, the model explainability is critical for many domains, such medical diagnosis, quantitiative trading and banking. We developed visual analytics techniques to make machine learning models explainable, trustworthy, and reliable.
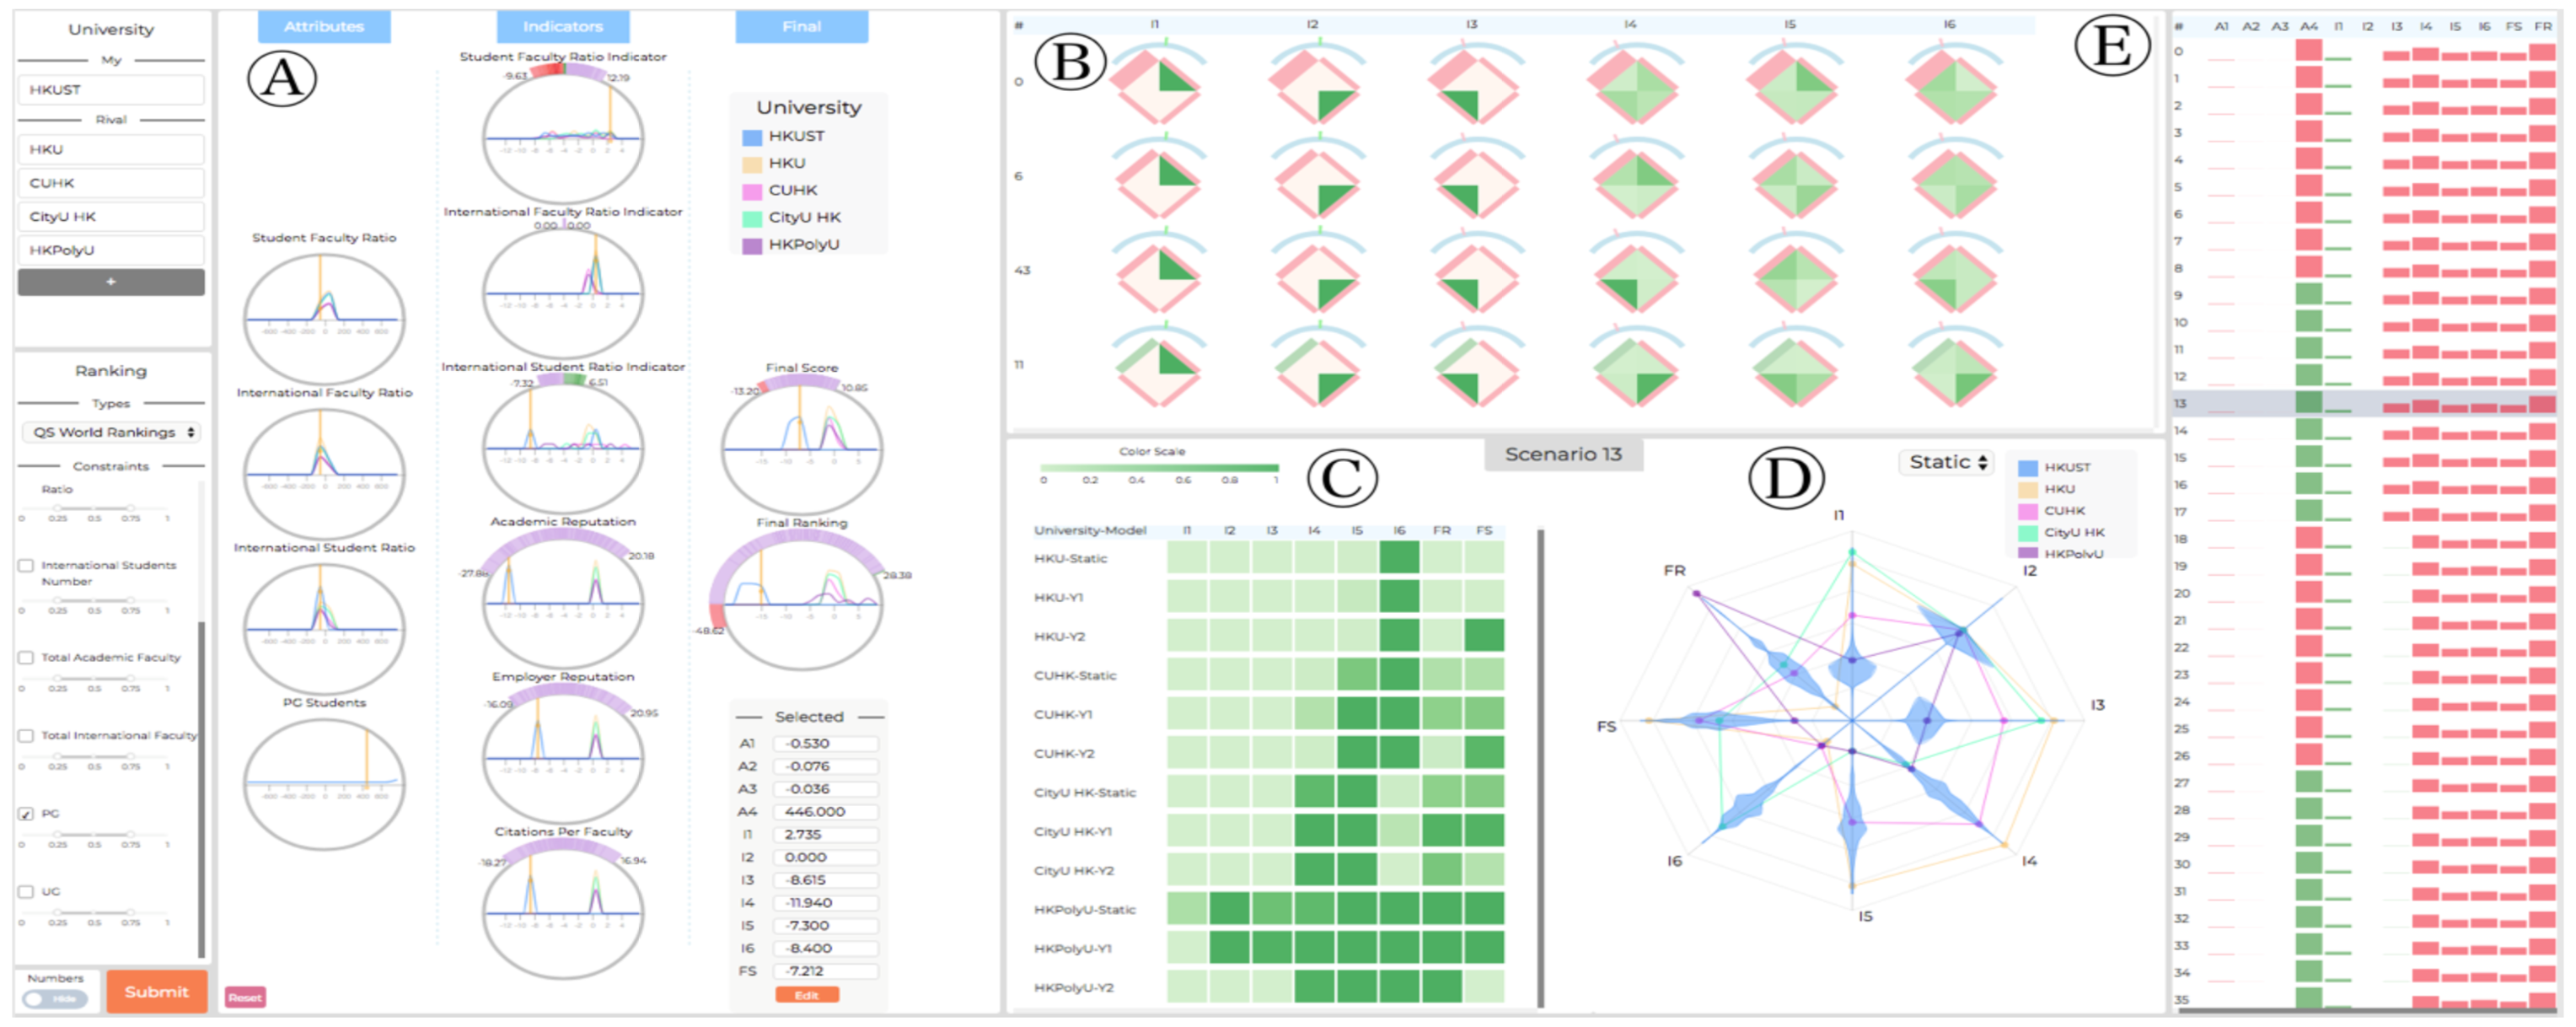
Social Media
Social media has become an indispensable part of modern daily life. Tons of user-generated content, such as text posts and comments and other interactions, has been generated and recorded. How to make sense of such big data has received huge attention from researchers. We develop interactive visual analytics approach to help different stakeholders explore and analyze social media data in a convenient and effective way, including local businesses comparison based on online reviews, user group exploration in online forums, and research impact analysis based on citation networks.